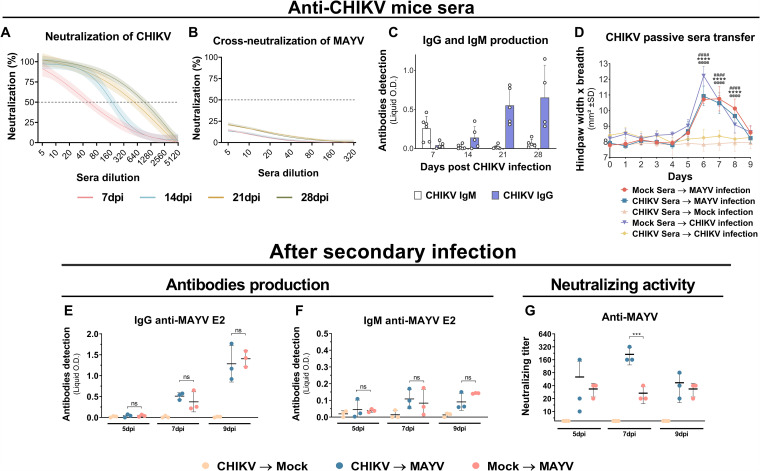
FIG 3.
Antibody levels and neutralization titers before and after secondary infection and in vivo cross-protection with sera from CHIKV-infected mice. The C57BL/6 mice were intraperitoneally infected with 106 PFU of CHIKV. Sera were taken once a week for 28 days. (A and B) CHIKV-infected mouse serum homologous and heterologous in vitro neutralization of CHIKV (n = 5 per group) or MAYV (n = 5 per group), respectively. Nonlinear regression curves were generated with a maximum number of interactions of 1,000 and 95% confidence intervals. Error bars are delimited by the colors. Dotted line delimitates 50% neutralization. (C) IgG and IgM quantification by indirect ELISA using recombinant CHIKV E2 protein (n = 4 or 5 per group). (D) Hind-paw swelling measurements after in vivo passive sera transfer from mock infection or CHIKV convalescent-phase sera to naive mice with subsequent hind-paw infection by MAYV or CHIKV (n = 5 per group). (E and F) IgG and IgM antibody quantification by indirect ELISA using recombinant MAYV E2 protein and (G) neutralizing activities against MAYV after secondary MAYV infection (n = 3 per group). Data are representative of two independent experiments. Statistical analysis was performed by two-way ANOVA with Tukey’s test. In panel D, significant differences (P < 0.0001) between the CHIKV Sera → Mock Infection group and other groups are indicated by “@@@@” (Mock Sera → CHIKV infection), “****” (CHIKV Sera → MAYV infection), and “####” (Mock Sera → MAYV infection). In panel G, significant differences (P < 0.0001) between the CHIKV → MAYV and Mock → MAYV groups are indicated by “***.” O.D., optical density; SD, standard deviation; ns, not significant different; dpi, days postinfection; PRNT, plaque reduction neutralization test.

