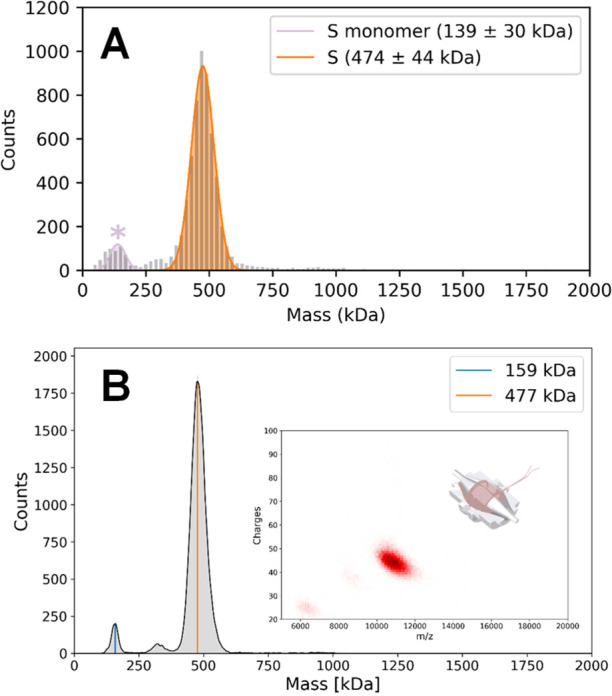
Figure 1.

Representative mass histograms of the SARS-CoV-2 S-trimer. (A) MP histogram. (B) 1D CD-MS histogram, with the 2D CD-MS histogram shown in the inset. The measured masses and abundances related to these data are provided in Table S1. In both cases, the S-trimer is the predominant species, with a minor contribution of S-monomer. A low population of particles corresponding to S-dimer (∼300 kDa) could also be detected. The total concentration of S-trimer is 100 nM.
