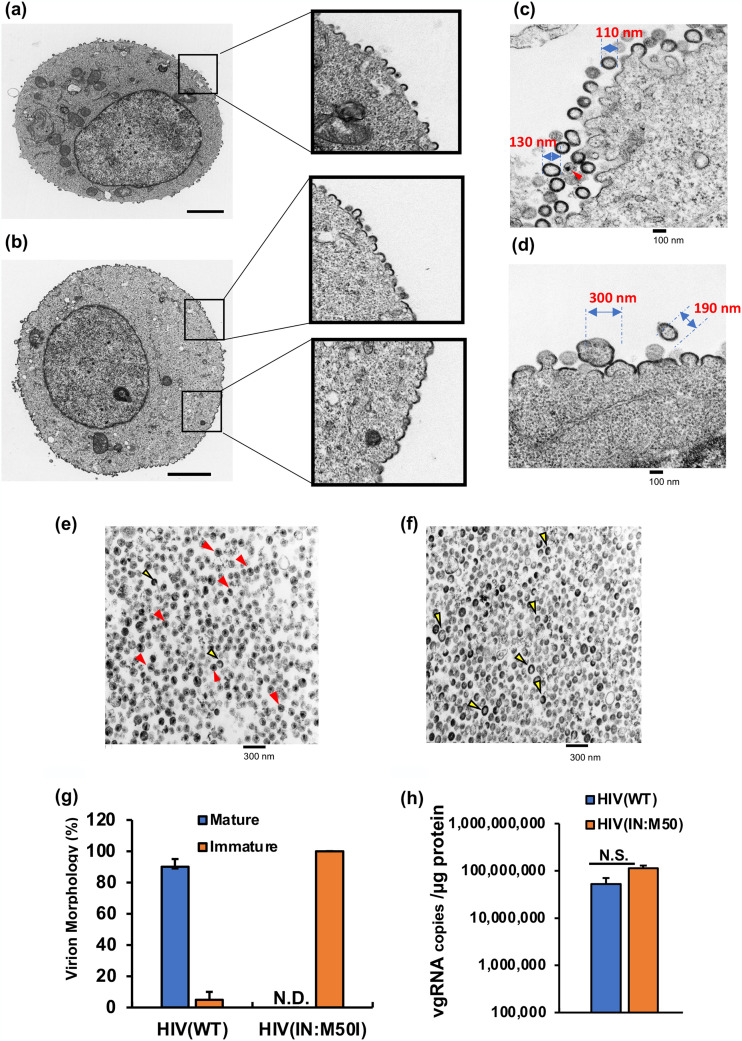
FIG 2.
Characterization of viral and cell morphologies. HEK293T cells were transfected with plasmid encoding HIV(WT) (a) or HIV(IN:M50I) (b) and cultured for 48 h; each cell was fixed and then subjected to TEM as described in Materials and Methods. Scale bars indicate 2 μm. Boxes indicate the magnified cell surface images. (c and d) HEK293T cells were transfected with plasmids encoding HIV(WT) (c) or HIV(IN:M50I) (d) and then cultured for 24 h. Cells were fixed and then TEM images were taken as described in Materials and Methods. (e and f) TEM image analyses of sucrose-purified HIV particles of HIV(WT) (e) and HIV(IN:M50I) (f). Red and yellow arrowheads indicate typical electron-dense particles with a conical core (red) and electron-dense particles without a core (yellow). Scale bars show 100 nm (c and d) and 200 nm (e and f). (g) The relative population of viral morphology was calculated from 1,000 particle images by three independent assays. Data indicate means ± standard errors (SE) (n = 3). (h) Viral genomic RNA copy numbers in viral stocks were compared between HIV(WT) and HIV(IN:M50I). Copy numbers were determined using the real-time HIV-1 assay kit from three independent virus stocks, and data were normalized to total viral protein. Data show means ± SE (n = 3).

