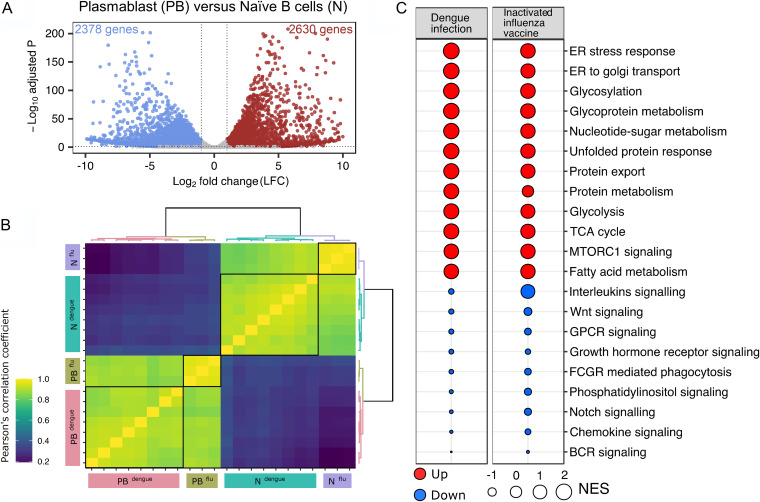
FIG 5.
Transcriptional profile of plasmablasts derived from individuals that received an inactivated influenza vaccine. (A) Volcano plot with −log-adjusted P values on the y axis and log2 fold changes on the x axis. Scattered dots represent genes. Red dots are 2,630 genes that are significantly upregulated and blue dots are 2,378 genes that are significantly downregulated in plasmablasts versus naive B cells (total of 5,008 genes). Gray dots are either nonsignificant, nondifferential, or both (for significant, adjusted P value of <0.05; for differential, log2 fold change greater than or equal to 1 or less than or equal to −1). (B) Sample-to-sample correlation heat map depicting Pearson’s correlation coefficients among samples of dengue and flu. Grouping patterns are represented by agglomerative hierarchical clustering by using the Ward.D2 method. The color key depicts a strong correlation for values of >0.8 (green) or a weak correlation for values of <0.4 (blue). (C) Comparison of GSEA terms enriched for plasmablasts versus naive B cells in flu with the terms enriched for plasmablasts versus naive B cells in dengue. The size of the bubble is proportional to the normalized enrichment scores (NES), and red and blue represent terms with positive and negative NES, respectively.

