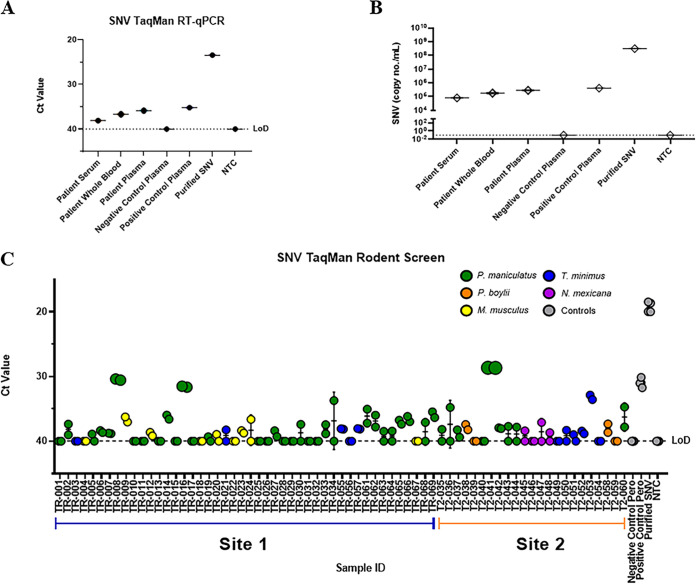
FIG 1.
SNV RT-qPCR detection in clinical samples and wild-caught rodents. (A) Singleplex SNV-specific amplification of patient samples using cycle threshold (CT) values plotted along with negative- and positive-control patient plasma and SNV-infected Vero E6 cells (Purified SNV). (B) Copies per milliliter were calculated using an SNV N gene plasmid standard curve with an R2 value of 0.998. (C) Lung tissues from wild-caught rodents were plotted using CT values, with each species labeled a color according to the key, along with controls from infected or uninfected rodents and purified SNV (gray). Limits of detection (LoD) for plots were determined using a no-template control (NTC).

