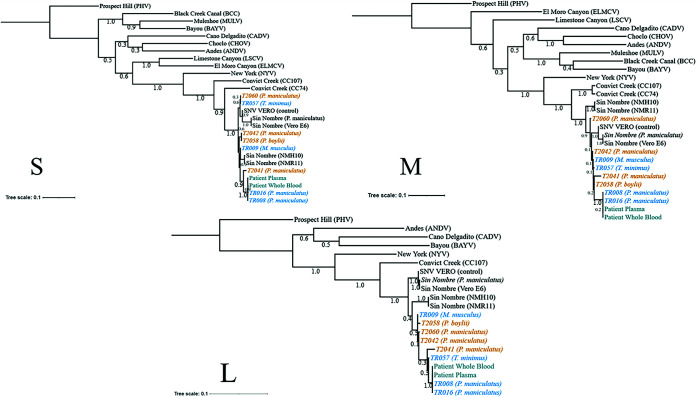
FIG 4.
Phylogenetic analysis of individual segments. A maximum likelihood tree was generated based on S, M, and L segments individually. The numbers below the branches indicate bootstrap values from 500 replicates. Rodents from site 1 (orange) and site 2 (blue) are labeled accordingly, along with patient samples (teal). The tree was rooted to the Prospect Hill reference sequence. Additional reference sequences were obtained through the NCBI. SNV-infected Vero E6 cells (SNV VERO) were used as positive sequencing controls. The bars represent the number of substitutions per site.

