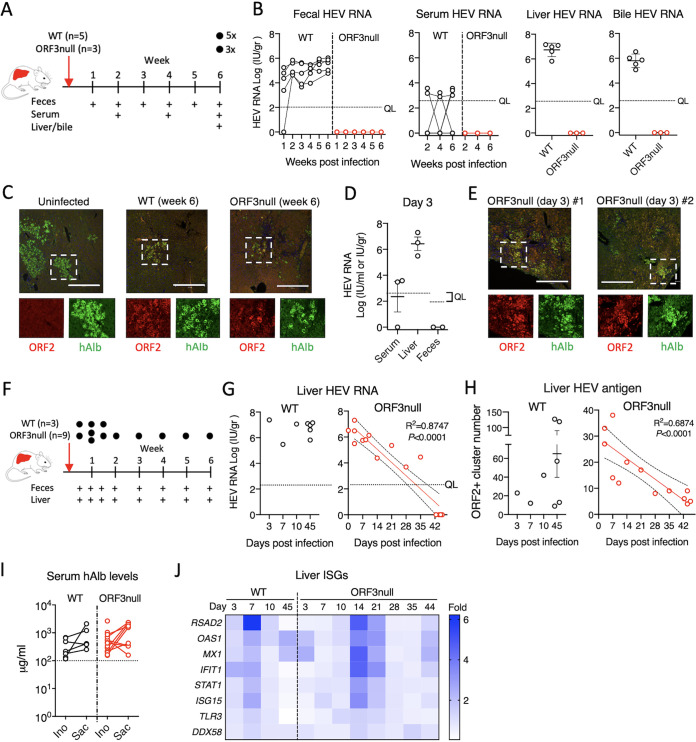
FIG 4.
ORF3 is essential for HEV fecal shedding and persistent infection in humanized mice. (A to C) Human liver chimeric mice were inoculated with equal amounts (106 GE) of WT (n = 5) or ORF3null (n = 3) HEV. Serum samples were collected biweekly, and feces were collected weekly. Mice were sacrificed 6 weeks after virus inoculation. (B) HEV RNA levels in feces and serum at the indicated times and in liver and bile at week 6 were quantified by qRT-PCR. The dotted horizontal line indicates the quantification limit (QL). (C) Immunofluorescence images showing HEV ORF2 (red) and human albumin (hAlb) (green) in liver sections from HEV-infected humanized mice 6 weeks after inoculation. Bars, 450 μm. (D and E) Humanized mice were inoculated with the ORF3null virus (n = 3) and sacrificed 3 days after virus inoculation. (D) qRT-PCR-quantified HEV RNA levels in serum, liver, and feces 3 days after HEV inoculation. The dotted horizontal lines indicate the quantification limits. (E) Immunofluorescence images showing HEV ORF2 (red) and human albumin (green) in liver sections from two different ORF3null-infected mice. Bars, 450 μm. (F to H) Humanized mice were inoculated with equal amounts (106 GE) of WT (n = 3) or ORF3null (n = 9) HEV and sacrificed at the indicated times (black dots). (G and H) HEV RNA (G) and antigen (ORF2) (H) levels in the livers of humanized mice. Note that 5 additional WT-inoculated animals and a total of 6 additional ORF3null-inoculated animals (panels B and D) were also included for analyses in panels G and H. A downward trend in liver HEV RNA and antigen in the ORF3null-inoculated group is depicted with a linear regression fit (slope with 95% confidence intervals). (I) Serum human albumin levels in WT- and ORF3null-inoculated animals (panels A to H) at the time of HEV inoculation (Ino) and at sacrifice (Sac). The dotted horizontal line indicates the established cutoff value for WT HEV permissiveness in humanized mice. (J) Heat map of intrahepatic ISG expression in HEV-inoculated humanized mice. Data are shown as mean fold changes relative to uninfected controls (n = 4). The numbers of animals included for analyses are as follows: 1 mouse for days 3, 7, and 10 and 3 mice for day 45 for the WT group and 1 mouse for days 10, 14, 21, 28, and 35; 3 mice for day 3; 2 mice for day 7; and 4 mice for day 44 for the ORF3null group.

