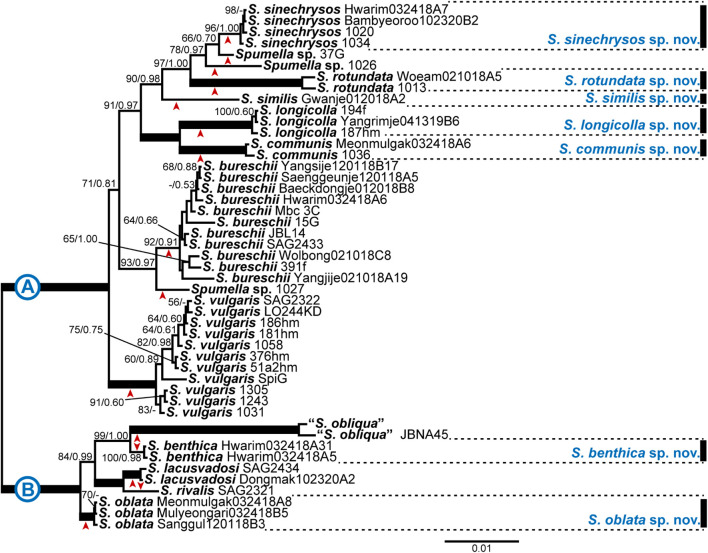
FIGURE 1.
Bayesian tree of the genus Spumella based on combined nuclear SSU and LSU rDNA and ITS sequence data. The maximum-likelihood bootstrap values (MLBS values, left) and Bayesian posterior probabilities (PPs, right) are shown at each node. The arrow head below or above each node indicates each lineage; the scale bar indicates the number of substitutions/site; the thick line indicates full support (100% MLBS and 1.00 PP), and (–) denotes values < 50% for MLBS or 0.50 for PP.

