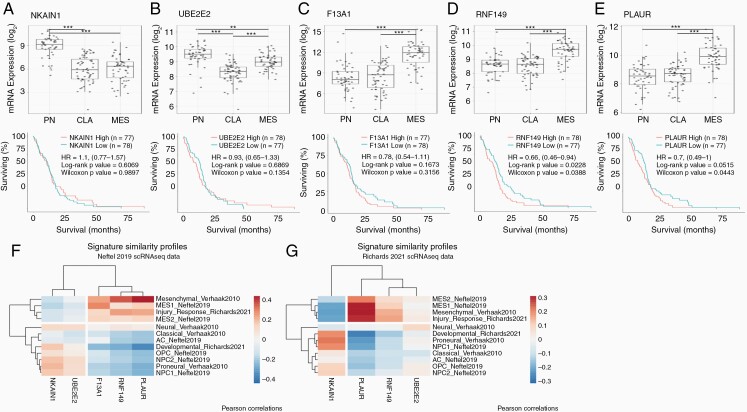
Figure 1.
Expression of 5-top genes across GBM subtypes and survival. Top panels show the gene expression of the top-5 genes (A) NKAIN1, (B) UBE2E2, (C) F13A1, (D) RNF149, and (E) PLAUR across proneural (PN), classical (CLA), and mesenchymal (MES) subtypes of GBM in Wang et al. (2017) study. Bottom panel shows corresponding survival data of GBM samples with high or low expression of the top 5-genes. Signature similarity profiles of single-cell RNA sequencing from (F) Neftel et al. (2019)10 dataset and (G) Richards et al. (2021)18 dataset. HR = log Hazard Ratio. **P < .01, ***P < .001.

