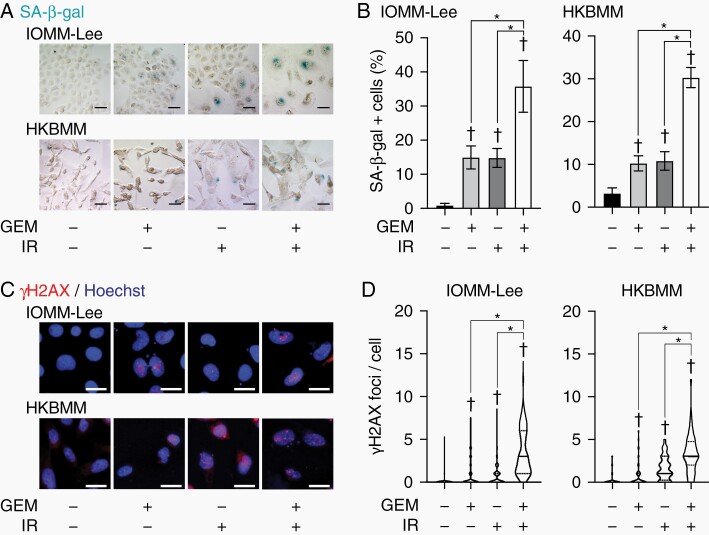
Figure 2.
Induction of senescence markers by gemcitabine and ionizing radiation.
IOMM-Lee and HKBMM cells were incubated without or with gemcitabine (3 nM for IOMM-Lee and 2 nM for HKBMM) for 4 days and not irradiated or irradiated twice by X-ray (1 Gy for IOMM-Lee and 2 Gy for HKBMM) on days 1 and 3, and then subjected to SA-β-gal staining (A) or immunocytochemistry for γH2AX (C) on day 4. The percentage of SA-β-gal-positive cells was quantified (n = 4, each group) (B). The number of γH2AX foci was counted (>60 cells were counted for each group) and shown as violin plots (D). GEM, gemcitabine. IR, ionizing radiation. Scale bars, 50 µm in (A) and 20 µm in (C). In (B), values are shown as mean ± SD. In (D), lines represent medians and dotted lines represent quartiles. P-values were calculated by a 1-way ANOVA with Tukey’s post hoc test (B) or by the Kruskal-Wallis test with Dunn’s multiple comparisons test (D). *P < .05. †P < .05 vs the Control (GEM− and IR−).

