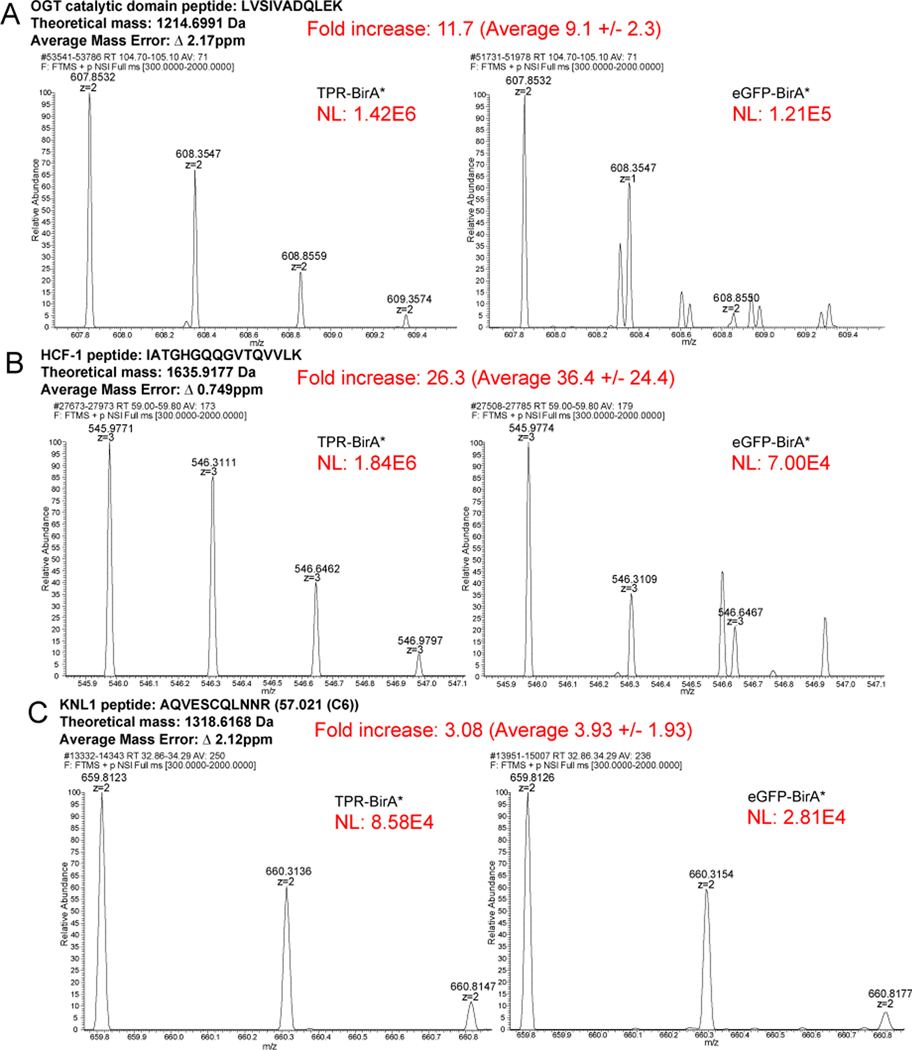
Figure 3: Reconstructed ion chromatograms confirm peptide-level enrichment of TPR-BirA* interactors.
Fold increase is for the replicate shown. The average fold intensity for that peptide (averaged across all replicates and fractions in which that peptide appeared) is shown with the standard deviation. Average mass error is the absolute value of the mean across 3 replicates of both TPR-BirA* and eGFP-BirA*. NL=Normalization Level (Base Peak Intensity) A, Rectonstructed ion chromatograms demonstrating greater enrichment of a catalytic OGT peptide in TPR-BirA* compared to eGFP-BirA*. B, Reconstructed ion chromatograms demonstrating greater enrichment of an FICF-1 peptide in TPR-BirA* compared to eGFP-BirA*. C, Reconstructed ion chromatograms demonstrating greater enrichment of a KNL1 peptide (novel interactor closest to cut-off for assignment) in TPR-BirA* compared to eGFP-BirA*.

