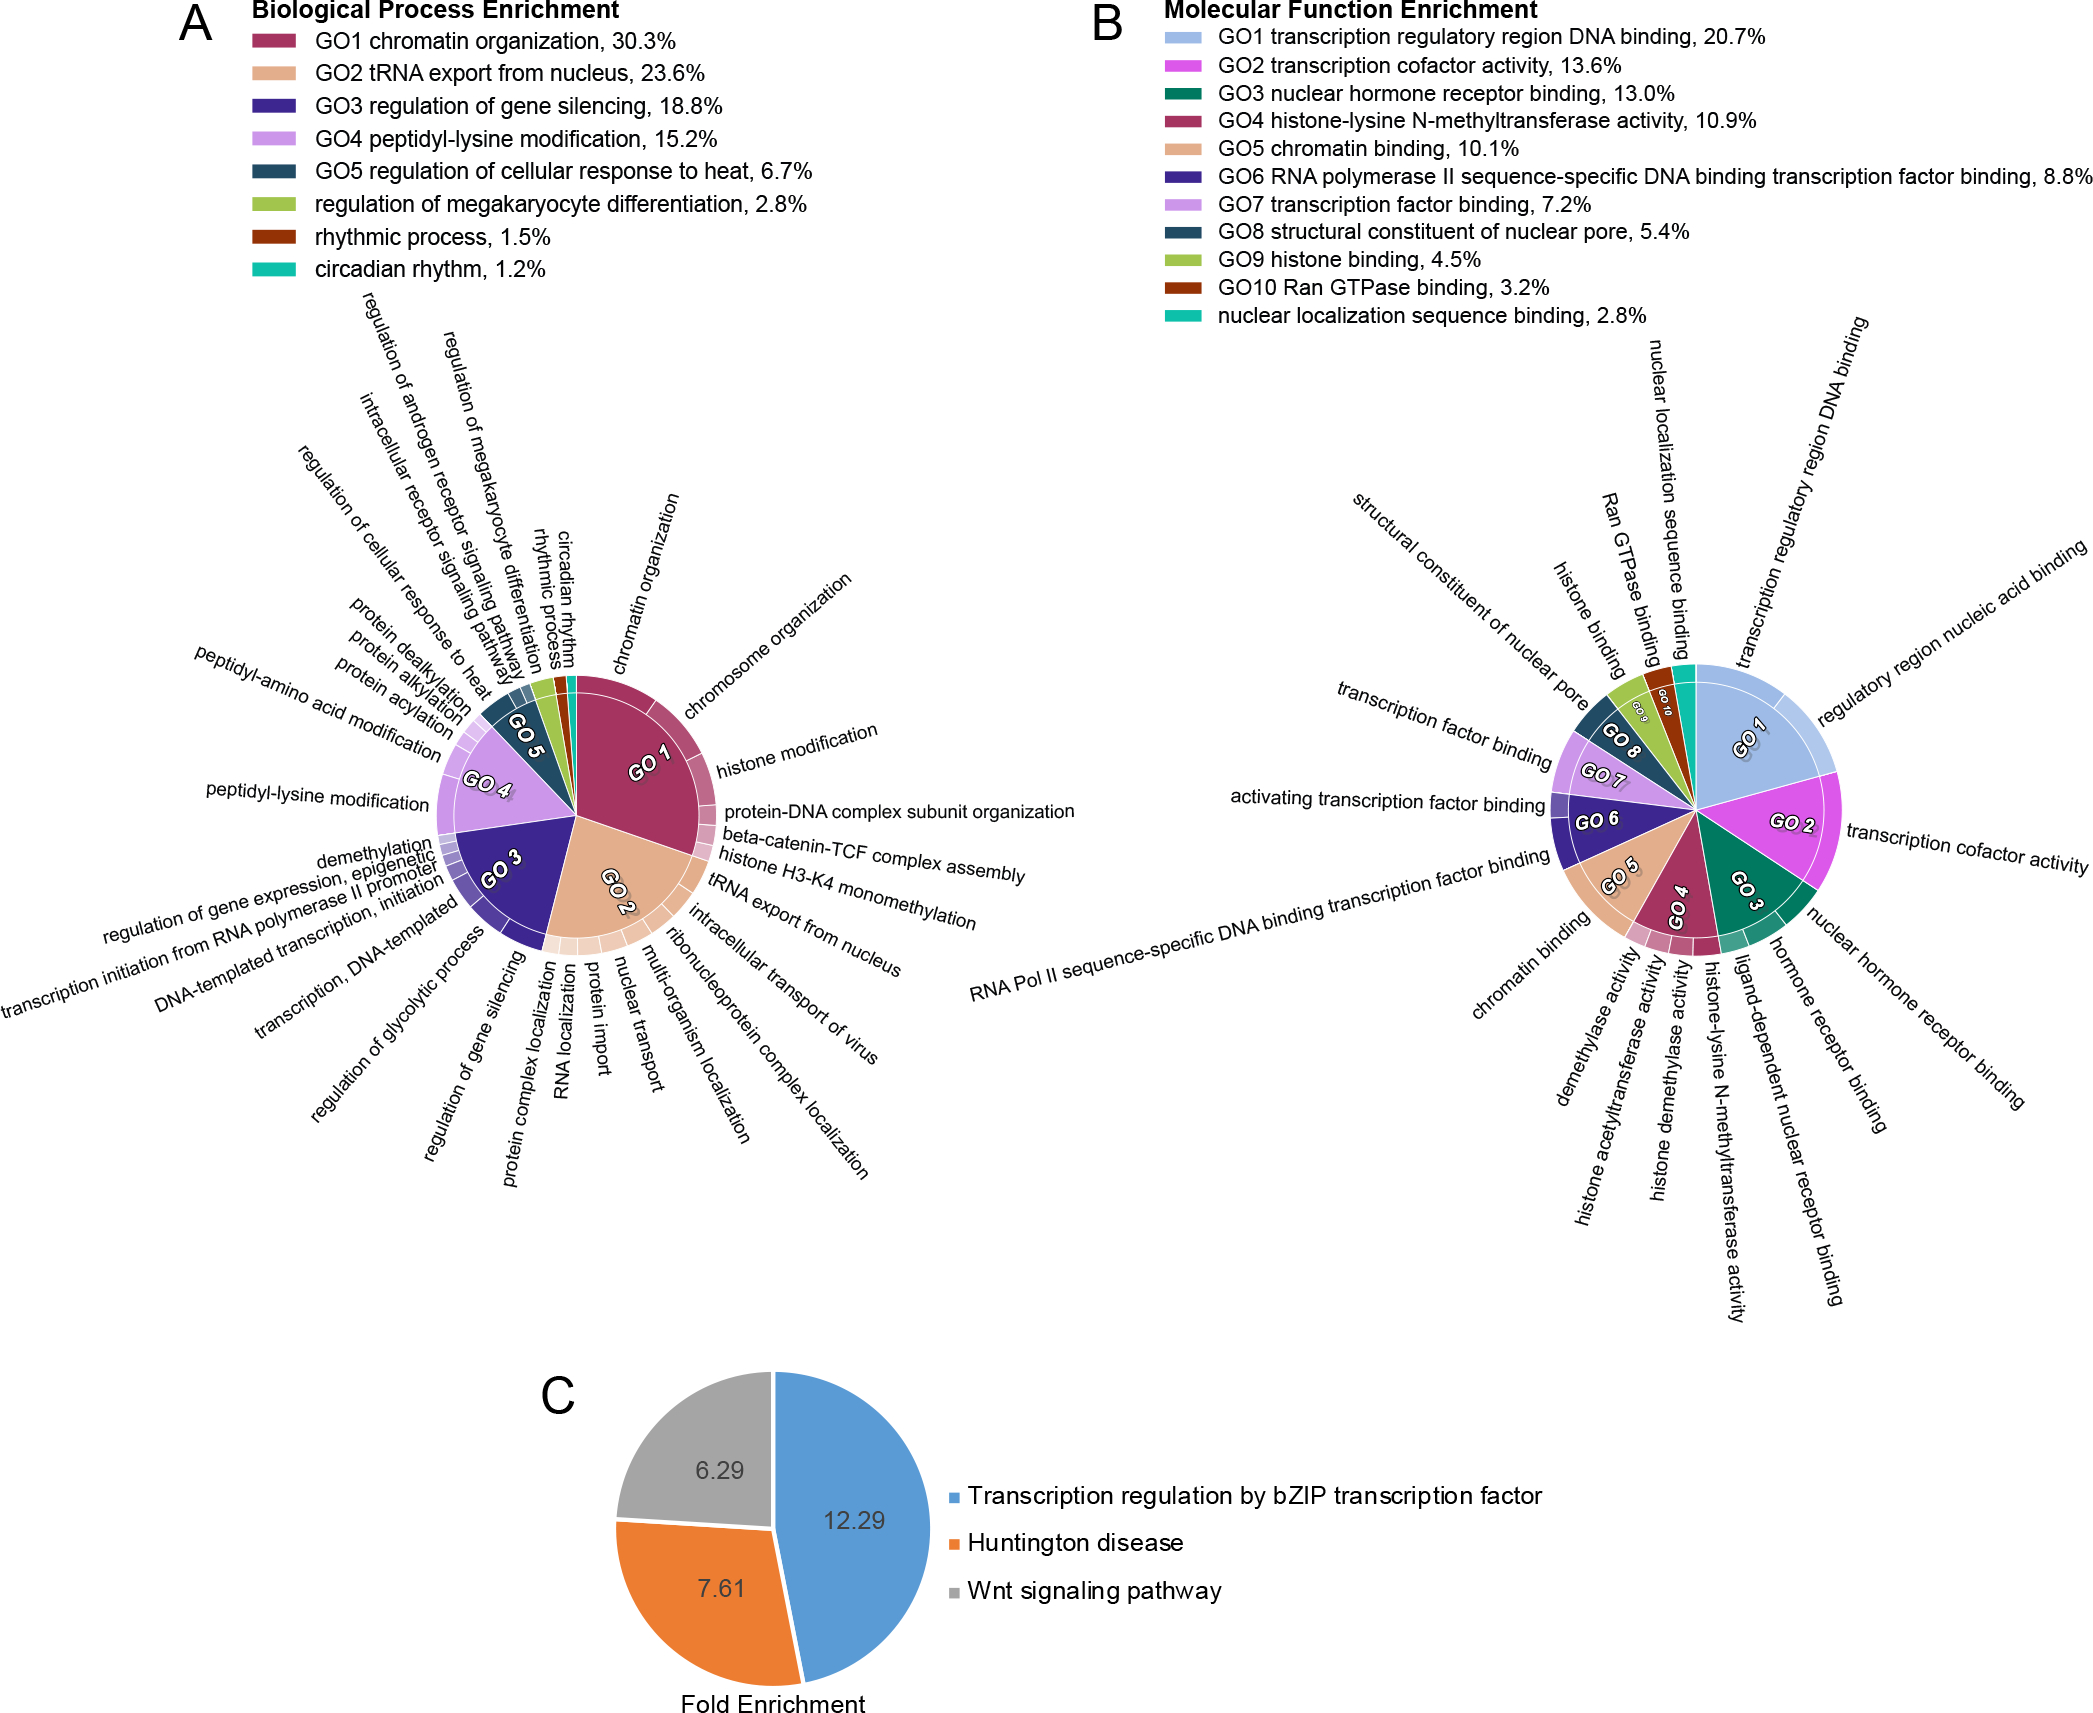
Figure 5: TPR interactors demonstrate enrichment in biological processes and disease states.

A, CirGo plot showing enriched biological processes in the TPR protein interactor list B, CirGo plot showing enriched molecular functions in the TPR protein interactor list C, Venn diagram of PANTHER Pathway enrichment of TPR interactors. Numbers are the fold enrichment of the pathway process over expected enrichment.
