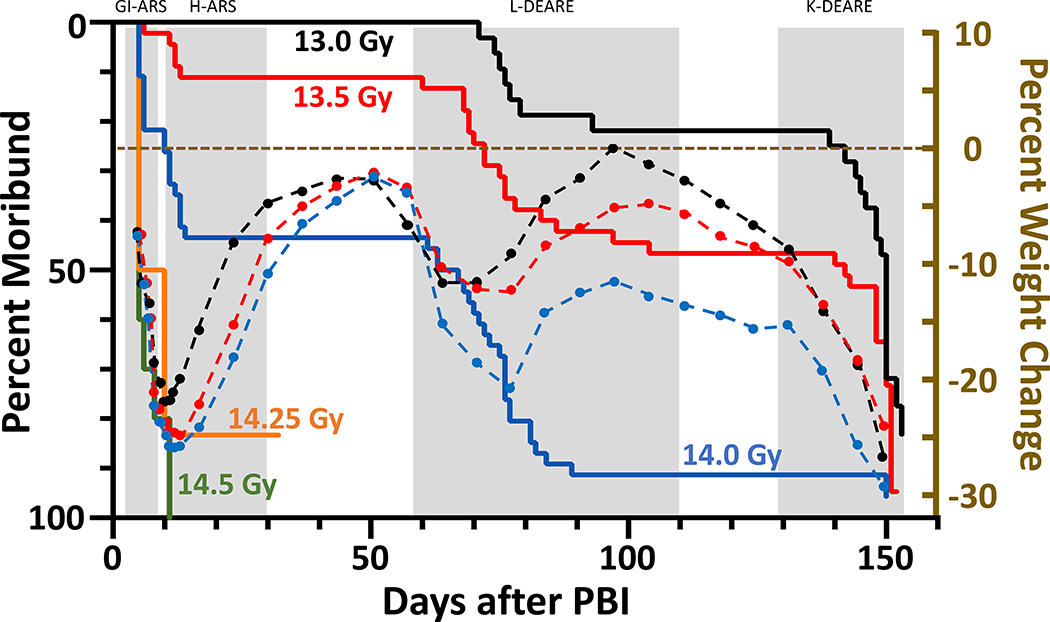
Figure 1.
Kaplan-Meier (KM) survival plots demonstrating dose- and time-dependent lethal sequelae observed after leg-out PBI in female rats. Female rats (11–12-week-old) received PBI at doses ranging from 13.0 to 14.5 Gy. Doses above 14 Gy (green and orange lines) result in > 80% morbidity during ARS. Survivors of the ARS (13 Gy (black line), 13.5 Gy (red line) and 14 Gy (blue line)) showed a dose-dependent survival during pneumonitis but were moribund from radiation nephropathy. At the doses delivered, all rats will develop radiation nephropathy after 120 days. To correlate body weight with organ specific sequelae, superimposed over the KM plot are the time courses (dashed lines) of average percent change in body weight from irradiation for 13.0 (black dots), 13.5 (red dots) and 14 Gy (blue dots). The body weight decreases prior to organ specific lethal sequelae.

