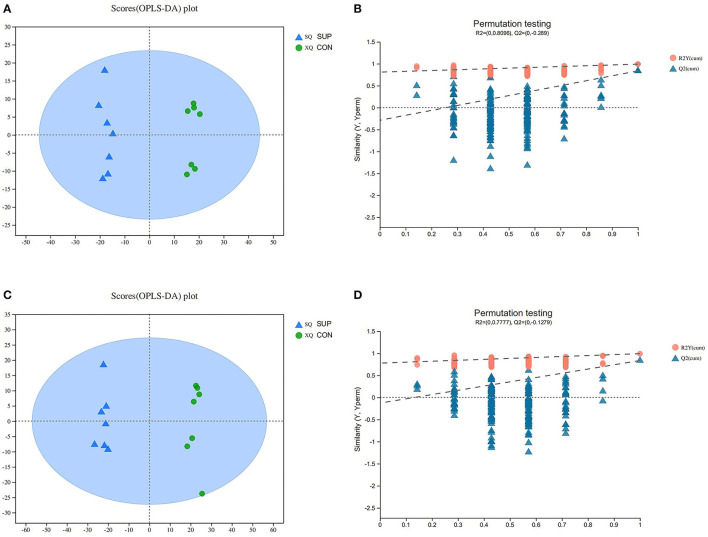
Figure 1.
Corresponding validation plots of orthogonal projections to latent structures-discriminate analysis (OPLS-DA) and permutation test of the OPLS-DA model (B,D) were derived from the UHPLC-QTOF/MS metabolomics profiles of serum. (A,B) and (C,D) were respectively, derived from POS and NEG for the serum samples. Blue and green respectively, represent SUP and CON administration to heifers. SUP, supplementation heifers; CON, grazing heifers. n = 7.

