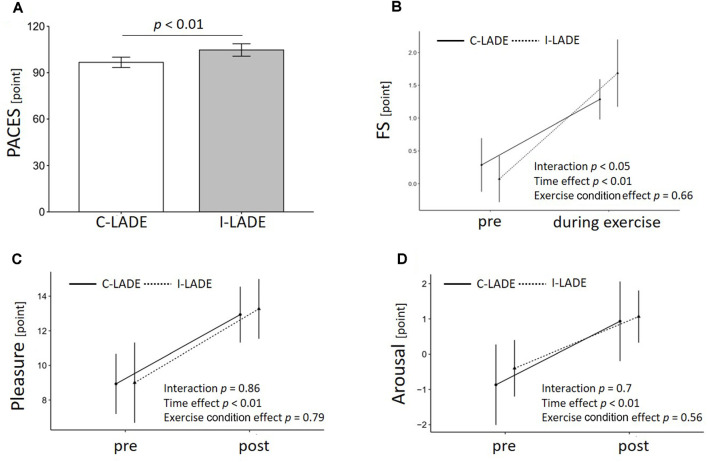
Figure 3.
Results of mood-related variable analysis. Means and standard deviations are shown. The p values in (A) show the results of the paired t-test. The p values in (B), (C), and (D) show the results of the two-way ANOVA with time and exercise condition as factors. PACES, Physical Activity Enjoyment Scale; FS, Feeling Scale; ANOVA, analysis of variance.

