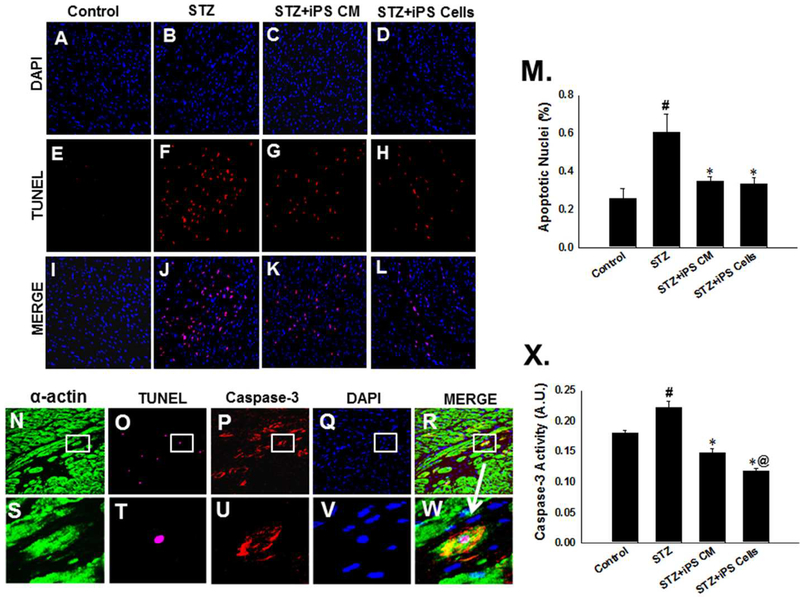
Figure 2: iPS cells and their CM inhibit apoptosis in STZ-IDC.
Representative photomicrographs of control, STZ, STZ+iPS-CM, and STZ+iPS cell hearts demonstrating total nuclei stained with DAPI in blue (A-D), apoptotic nuclei stained with TUNEL in red (E-H), and merged nuclei in pink (I-L). Magnification, 40X. M: Histogram shows quantitative % apoptotic nuclei per total nuclei from control and treated groups. #p<0.01 vs. control and *p<0.01 vs. STZ. N-R: Representative photomicrographs of apoptotic cardiac myocytes with cardiac myocytes stained with α-actin in red (N), apoptotic nuclei stained with TUNEL in pink (O), apoptotic cells stained with caspase-3 in red (P), nuclei stained with DAPI in blue (Q), merged image (R) and enhanced images in S-W. X: Histogram shows quantitative caspase-3 activity from control and experimental groups. #p<0.01 vs. control, *p<0.001 vs. STZ, and @p<0.05 vs. STZiPS-CM.

