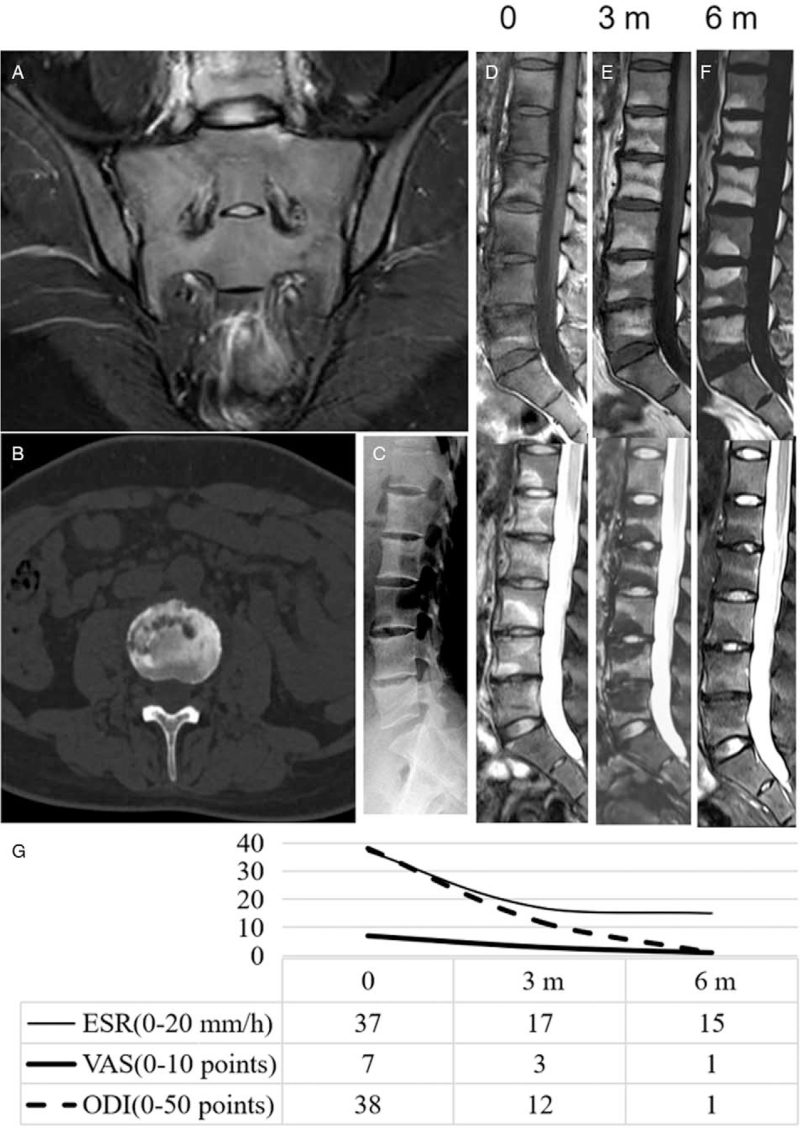
Figure 1.
X-ray, CT, MRI scan, ESR (0–20 mm/h), VAS (range: 0–10) score, and ODI (0–50 points) score. (A) MRI of the sacroiliac joint was normal. (B) Lumbar spine CT shows vertebral edge destruction. (C) Lumbar spine X-ray shows straightening of the lumbar spine curvature, poor alignment, bone hyperplasia in the vertebral body, and L4–5 vertebral space stenosis. (D–F) Lumbar spine MRI shows T12–L5 VESB signal changes, with T1 hypointensity (upper) and T2 hyperintensity (lower). (E) Lumbar spine MRI after 3 months of treatment; (F) Lumbar spine MRI after 6 months of treatment; (E, F) Additional MR examination shows L1–5 VESB changes, with T1 hyperintensity (left) and T2 hypointensity (right). (G) The chart shows the changes in ESR, VAS, and ODI scores before and after treatment. CT: Computed tomography; ESR: Erythrocyte sedimentation rate; MRI: Magnetic resonance imaging; ODI: Oswestry Disability Index; VESB: Vertebral endplate subchondral bone; VAS: Visual analog scale.

