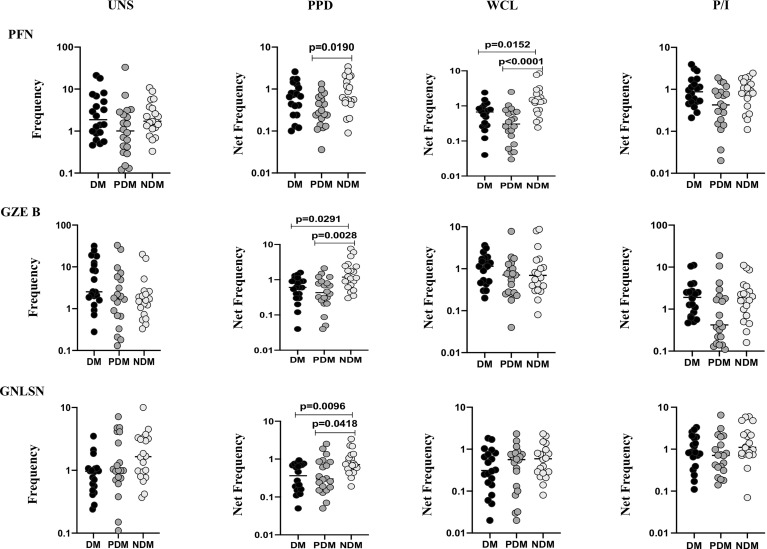
Figure 3.
Decreased frequencies of γδ T cells expressing cytotoxic markers in LTB comorbidities. PBMCs were either untreated or treated with Mtb or positive control antigens for 18 h. The absolute (unstimulated, UNS) and antigen-stimulated (PPD, WCL, P/I) net frequencies of cytotoxic (PFN, GZEB, GNLYSN) markers were shown in LTB DM (n = 20), LTB PDM (n = 20), and LTB NDM (n = 20) groups. Geometric mean values were represented using bars, and every circle denotes a single individual. Kruskal–Wallis test with multiple Dunn’s comparison were used to determine the p values.

