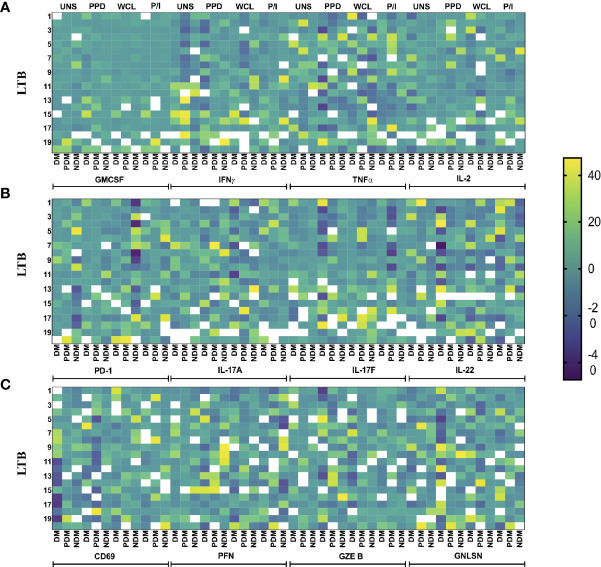
Figure 6.
Heatmap analysis of γδ T cells. The cytokine and cytotoxic and immune marker frequencies were normalized across all LTB groups, and the expression data are shown. Each column indicates a single person. We show the heatmap expression of (A) GMCSF and Th1 cytokines, (B) PD-1 and Th17 cytokines, and (C) PD-1 and cytotoxic markers in LTB patients coinfected with DM (n = 20), PDM (n = 20), and NDM (n = 20) individuals upon UNS, Mtb (PPD, WCL), and positive antigen (P/I) control stimulation with continuous color shading.

