Figure 5. CD300a inhibits TLR3-mediated interferon-β (IFN-β) expression upon recognition of tumor-derived exosomes.
(A) Representative microscopy images of wild-type (WT) and Cd300a−/− bone marrow-derived dendritic cells (BMDCs) treated with pHrodo-labeled extracellular vesicles (EVs) to assess the localization of EVs (red) and early endosome antigen (EEA)-1 (green). Scale bar, 10 μm. Data are representative of two independent experiments. (B) Uptake of PKH-labeled tumor-derived EVs (TEVs) in WT (n = 5) and Cd300a−/− BMDCs (n = 5). (C) Representative microscopy images of WT and Cd300a−/− BMDCs treated with pHrodo-labeled exosomes to assess the localization of exosomes (green), TLR3 (red), and CD300a (blue). Scale bar, 10 μm. Data are representative of two independent experiments. (D) Quantitative RT-PCR analysis of Ifnb in WT and Cd300a−/− BMDCs treated with B16-derived exosomes in the presence of dimethyl sulfoxide (DMSO) (WT, n = 9; Cd300a−/−, n = 10), 100 nM TLR4 inhibitor (n = 7 in each group), and 50 μM TLR3 inhibitor (n = 6 in each group). (E) Quantitative RT-PCR analysis of Ifnb in WT, Cd300a−/−, ticam-1−/−, and ticam-1−/−;Cd300a−/− mice-derived BMDCs treated with B16-derived EVs (n = 5 in all group). (F) Representative immunoassay of WT and Cd300a−/− BMDCs left unstimulated (0 min) or stimulated for the indicated times with B16-derived exosomes, followed by immunoblot analysis of phosphorylated (p-) interferon regulatory factor 3 (IRF3) or total IRF3. Data are representative of two independent experiments. (G and H) Comparison of tumor growth and survival curves of B16 melanoma cells between ticam-1−/− (n = 6) and ticam-1−/−;Cd300a−/− ice (n = 9) after inoculation of B16 melanoma. (I and J) Comparison of tumor growth and survival curves of B16 melanoma between MyD8−/− (n = 9) and MyD88−/−;Cd300a−/− mice (n = 10) after inoculation of B16 melanoma. Data are given as means ± standard error of the means (SEMs). N.S.: not significant. *p < 0.05, **p < 0.01, and ***p < 0.001. p values were obtained by using the Student’s t-test (B), a two-way analysis of variance (ANOVA) followed by Bonferroni’s post-test (D, E, G, and I), and the log-rank test (H and J). Data were pooled from two (B, E, and H) or three (D, I, and J) independent experiments.

Figure 5—figure supplement 1. CD300a is localized on the surface of plasma membrane without stimulation.

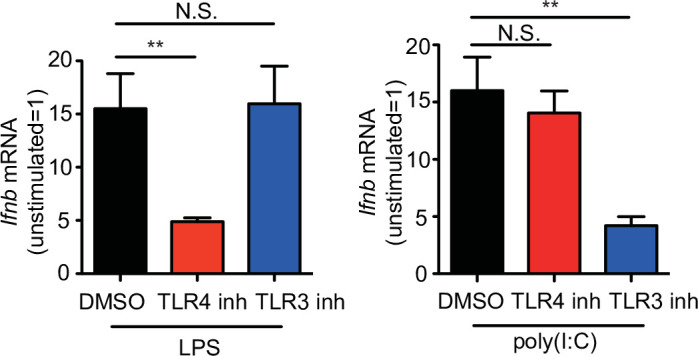
Figure 5—figure supplement 2. The inhibitors of TLR4 and TLR3 suppress the expression of Ifnb.