. 2021 Oct 4;10:e69479. doi: 10.7554/eLife.69479

Figure 4. Functional dissection of the large third intron of CACNA1C.

(A) UCSC Genome Browser representation of amplicons #1 through #7 in the third intron of CACNA1C (hg38, chr12:2,220,500–2,242,499). UCSC tracks for GENCODE v36 and 100 vertebrate conservation, normalized coverage of aligned reads for the previral library, and DNA and RNA samples for the four biological replicates are shown; y-axis scale is 0–50,000 reads. MPRA analysis is shown as graphs of linear model residuals and -log10 transformed p-values. Three amplicons, #3, #6, and #7, were found significantly active in our assay. Amplicons which were tested in single-candidate experiments are highlighted (red for no activity in MPRA, blue for significant activity in MPRA) (B) Confocal images of single-candidate validation of amplicons #2, #3, and #6. Mice were transduced at P0 with two AAV vectors: one for an HspMinP-EGFP-3’-UTR enhancer reporter construct carrying the indicated amplicon and a second control vector, CAG-mRuby3. Brains were fixed at P7 and sectioned and stained with an antibody for EGFP for signal amplification. Tiled, whole section images are shown on the left. Closeup of boxed regions are shown in the panels on the right. Green, EGFP; red mRuby3; grey, DAPI. These experiments validated robust EGFP expression driven by the two positive MPRA hits (#3 and #6), with substantial EGFP reduction for the MPRA negative amplicon #2. (C) Mice were transduced with AAV including positive amplicon #3 and processed as in B, but were raised to P28 before fixing, sectioning, and staining.

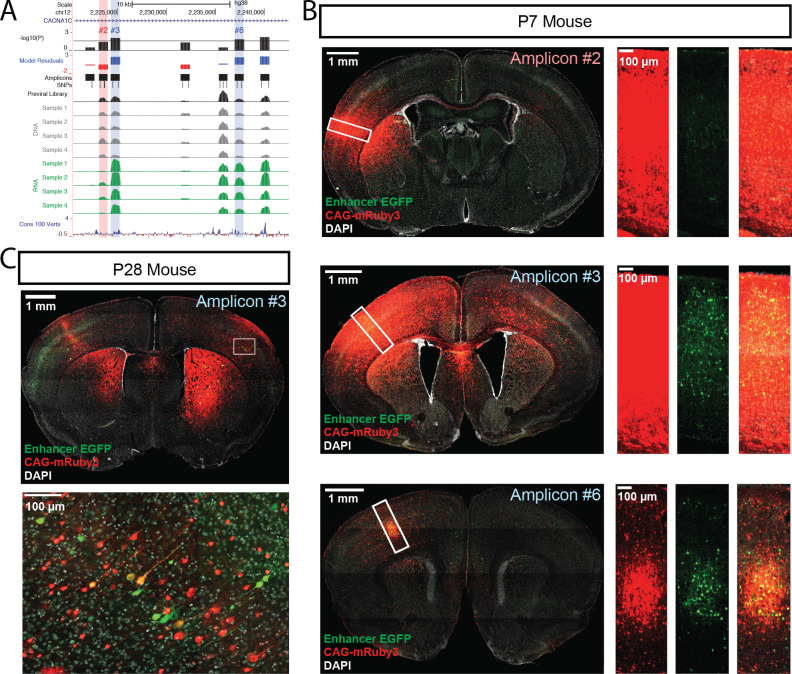
Figure 4.

Figure 4—figure supplement 1. Functional dissection of the third intron of CACNA1C.

Figure 4—figure supplement 1.

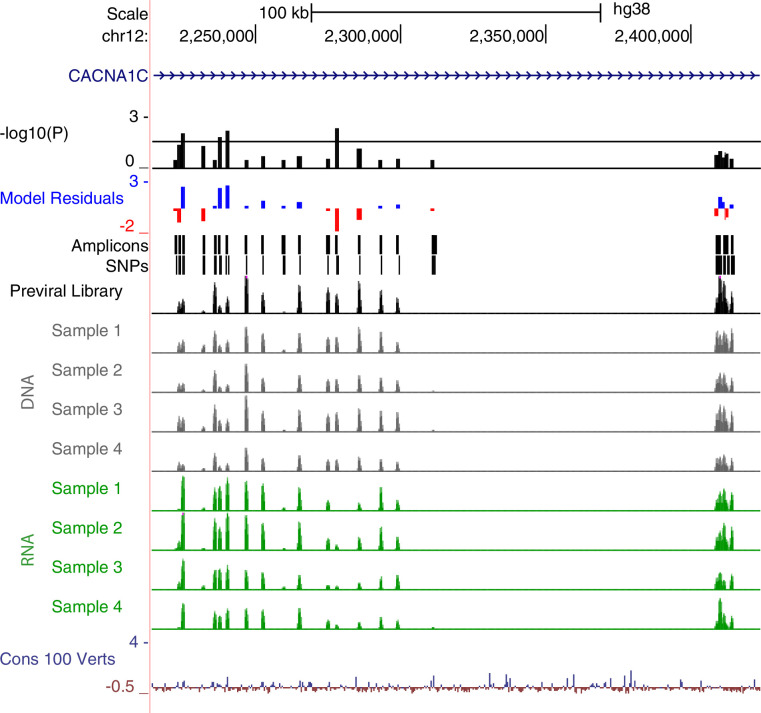
UCSC Genome Browser representation of amplicons #1 through #22 in the third intron of CACNA1C (hg38, chr12:2,214,000–2,423,999 shown). UCSC tracks for GENCODE v36 and 100 vertebrate conservation are shown. Normalized coverage of aligned reads for the previral library, and DNA and RNA samples for the four biological replicates are shown; y-axis scale is 0–50,000 reads. MPRA analysis is shown as graphs of linear model residuals and -log10 transformed p-values. Amplicons #18 through #22 (far right) represent regions spanning hematocrit-associated SNPs, which do not show activity in our assay.
Figure 4—figure supplement 2. Amplicon #3 in the large intron of CACNA1C continues to drive EGFP expression in mouse brain at P28.

Figure 4—figure supplement 2.

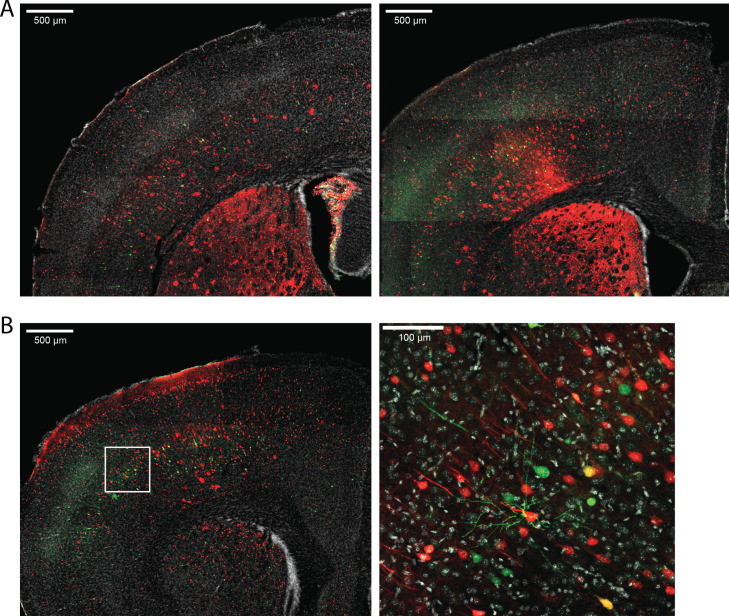
Mice injected intracranially with scAAV9-HspMinP-EGFP-#3 and AAV9-CAG-mRuby3 at P0 show robust expression of EGFP driven by the enhancer candidate Amplicon #3 at P28. (A) 5x confocal images showing EGFP and mRuby3 expression in two representative mice. (B) 5x and 25x images showing expression in a third representative mouse.
Figure 4—figure supplement 3. Replicates for functional dissection of CACNA1C LD interval.

Figure 4—figure supplement 3.

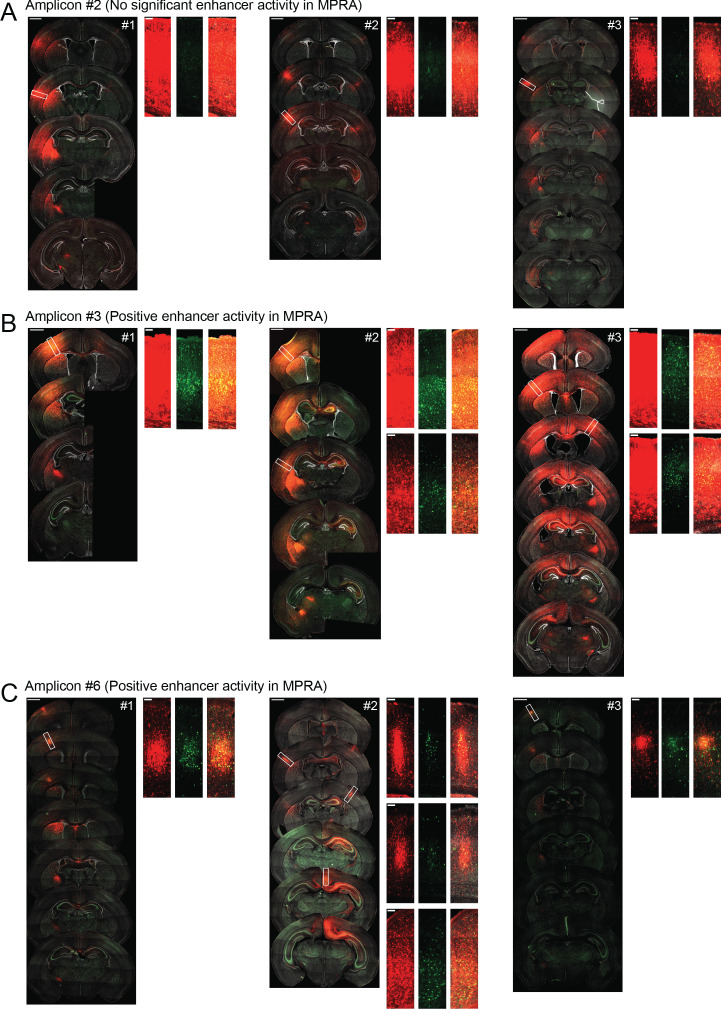
Representative confocal images of coronal sections of brains transduced at P0 with AAV9-CAG-mRuby3 and either scAAV9-HspMinP-EGFP-#2, scAAV9-HspMinP-EGFP-#3, or scAAV9-HspMinP-EGFP-#6, three replicates for each condition. For each brain, the left panel shows a spread of coronal sections sampling the injection site as it appears across multiple sections of the brain (scale bar = 1 mm), and the right panels are close up views of the boxed regions on the left panel (scale bar = 100 µm). mRuby3 is shown in red, EGFP is shown in green, DAPI is shown in gray.