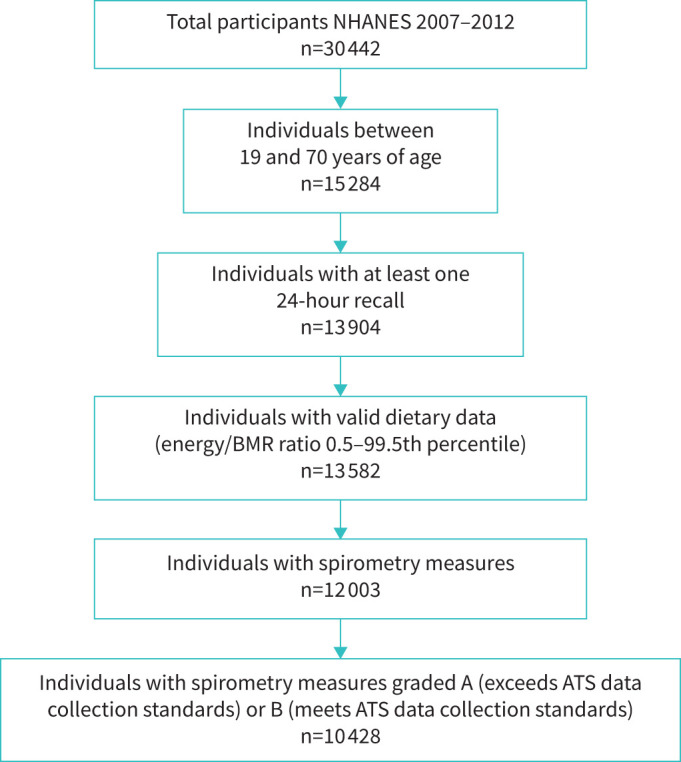
FIGURE 1.

Flow diagram of participants from the National Health and Nutrition Examination Survey (NHANES) included in the study. BMR: basal metabolic rate; ATS: American Thoracic Society.

Flow diagram of participants from the National Health and Nutrition Examination Survey (NHANES) included in the study. BMR: basal metabolic rate; ATS: American Thoracic Society.