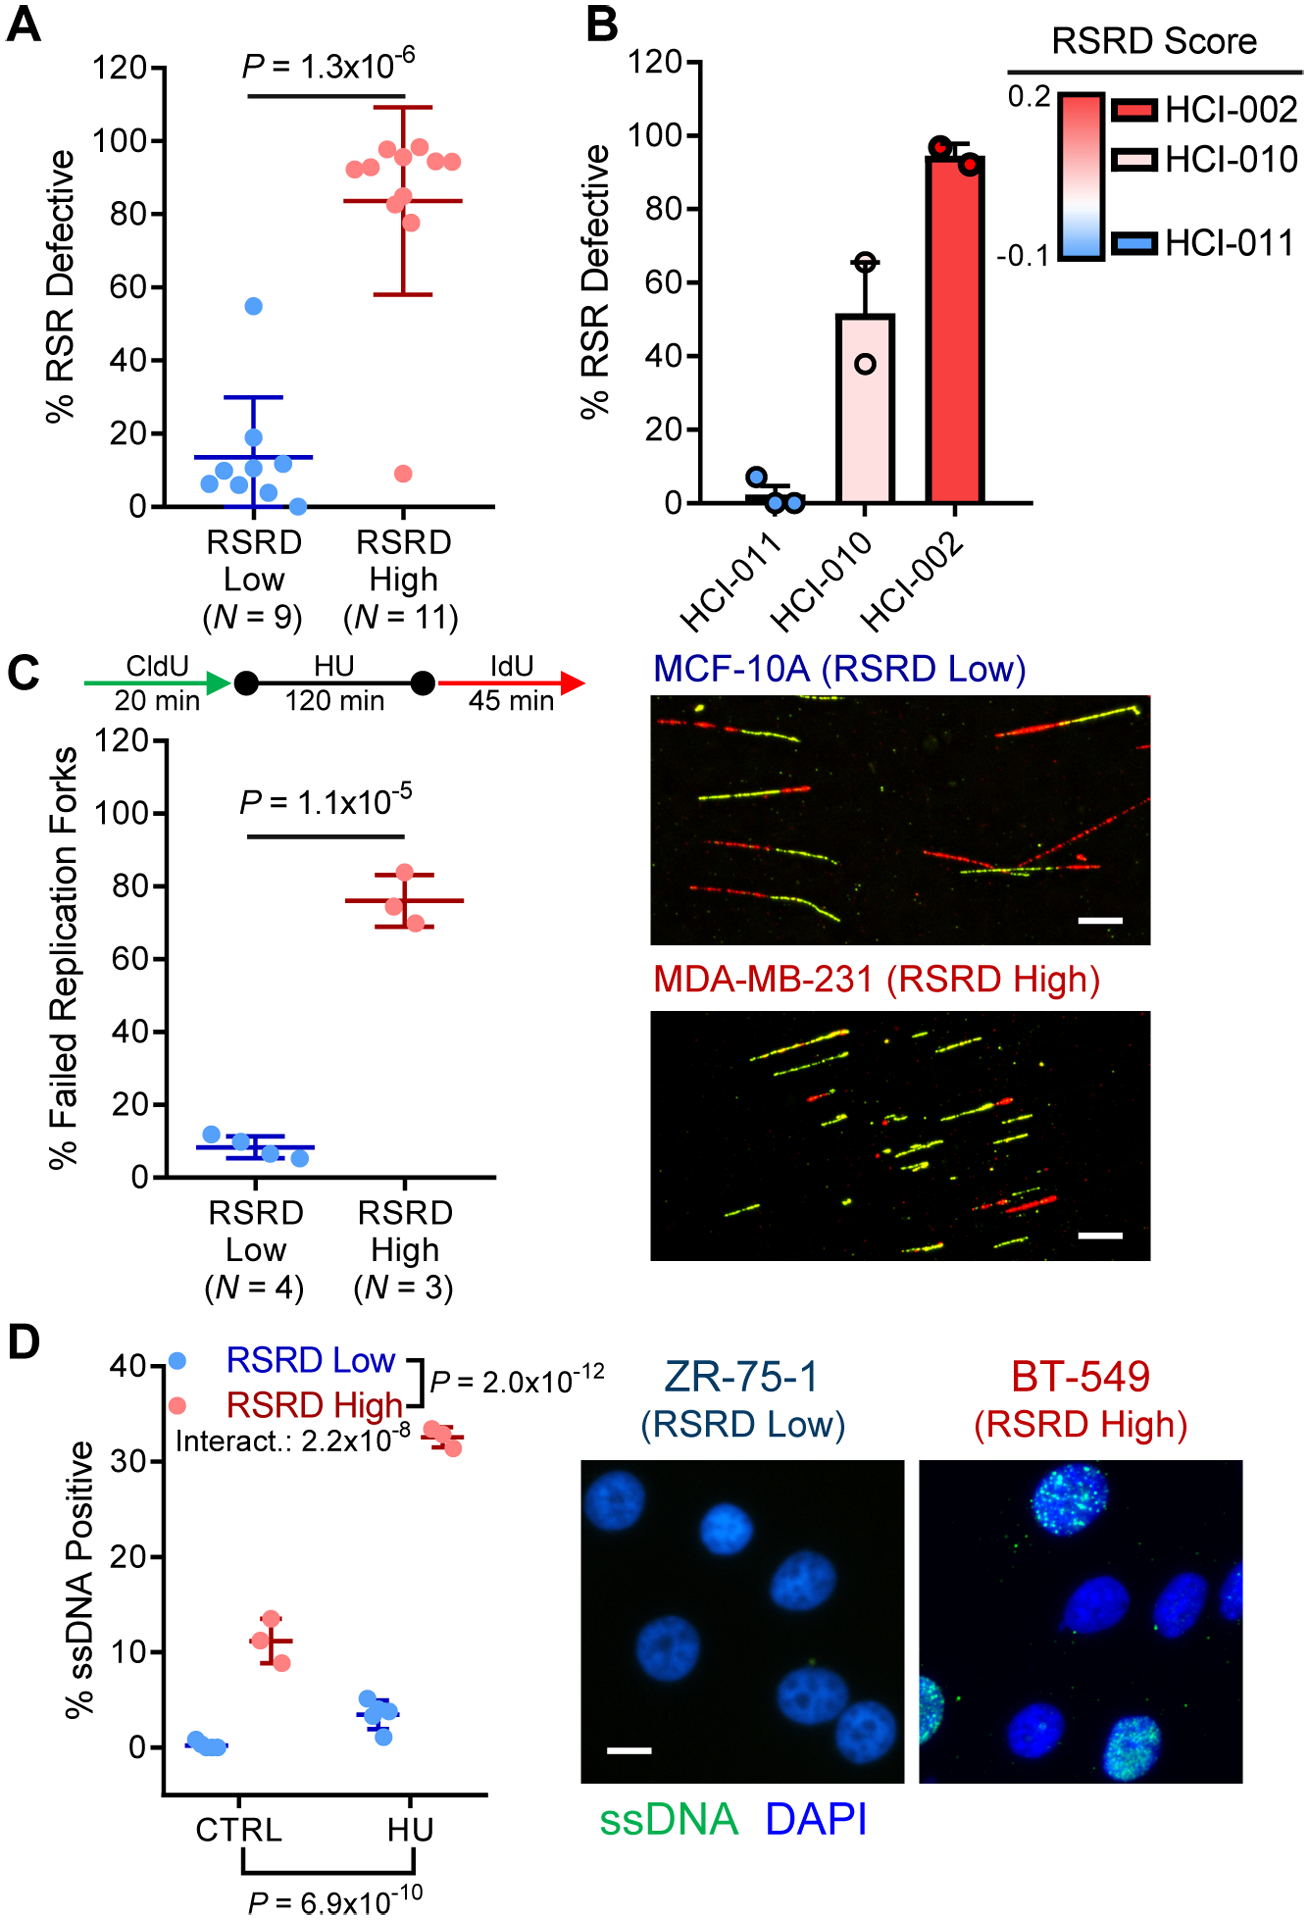
Fig. 1. RSRD gene expression signature predicts functional RSR defects in breast cancer cell lines and organoids.

A, RSR function assessed by fraction of cells capable of completing cell cycle after hydroxyurea (HU)-induced replication stress (57). See fig. S1, A to C. Two-tailed t-test.
B, RSR deficiency as assessed by cell cycle assay in 3 organoid models derived from PDXs (58), sorted by RSRD score. Dots represent biological replicates.
C, Quantification of fork restart following HU-induced replication stress in a panel of RSRD-low and -high cell lines (left) and representative images (right). Replicating DNA was labeled with CldU (green) before stalling replication forks with HU. After HU washout, restarted replication forks were labeled with IdU (red). Percentage of failed replication forks was determined for at least 100 CldU-labeled fibers per cell line. Scale bar indicates 10 μm. Two-tailed t-test.
D, Native CldU staining to detect ssDNA (green) in control (CTRL) cells or following 6-hour incubation with HU along with nuclear counterstain (blue). Representative cell lines shown to the right. N = 3 cell lines per condition. Two-way ANOVA.
All data are mean ± s.d. with each dot representing an individual cell line.
