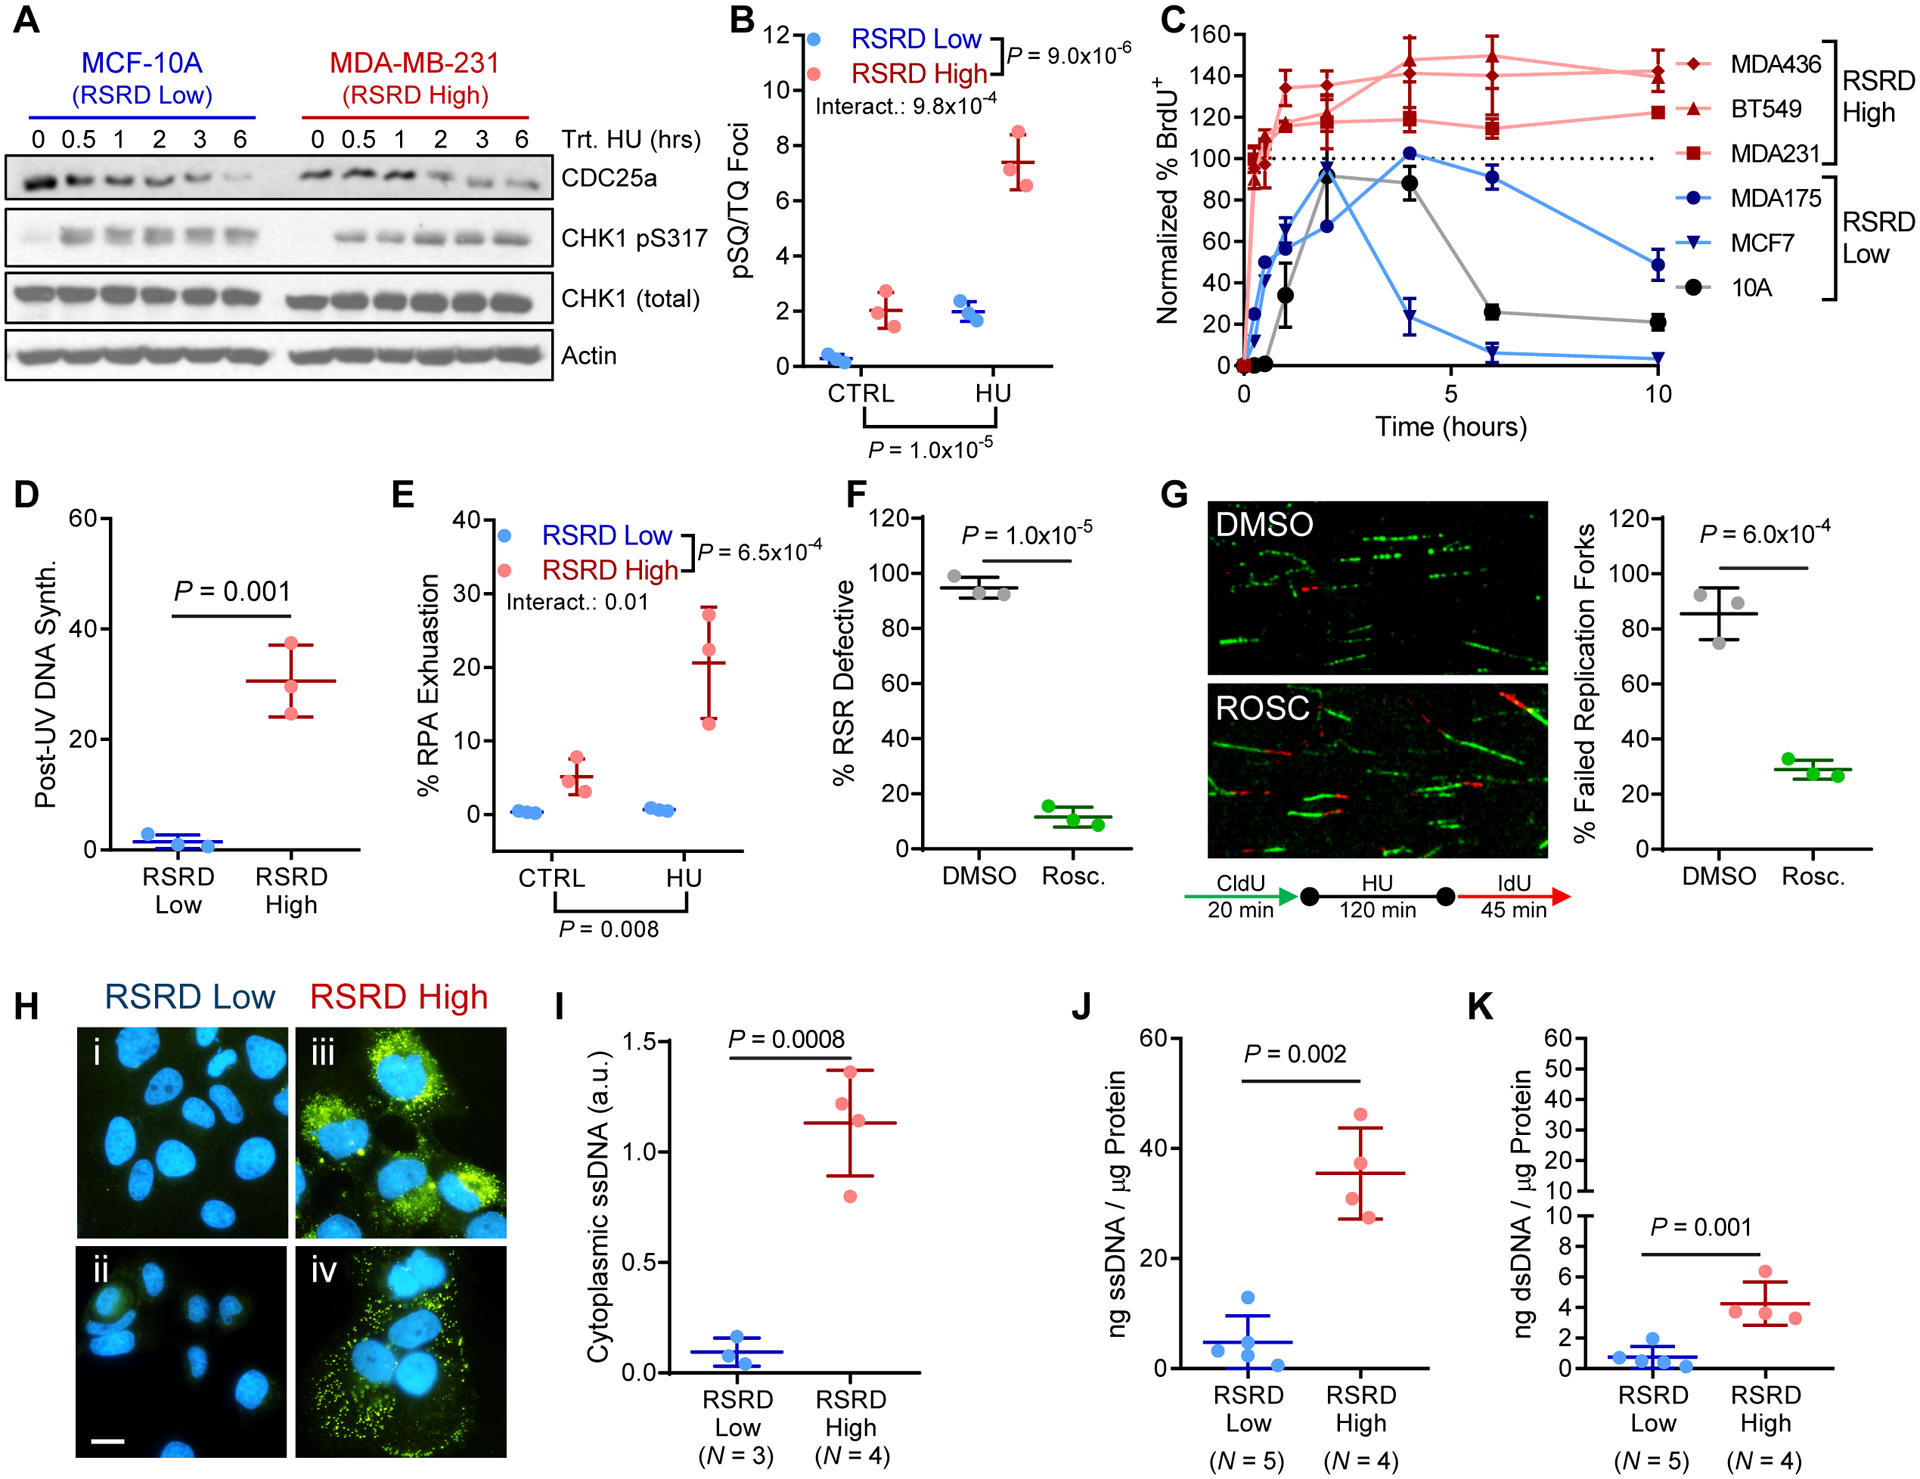
Fig. 2. RSRD-high cell lines undergo RPA exhaustion from aberrant replication origin firing causing accumulation of cytosolic DNA.

A, CHK1 activation following treatment with HU. RSRD-low MCF-10A and RSRD-high MDA-MB-231 show similar amounts of CHK1 phosphorylation and CDC25a degradation by Western blot.
B, Quantification of phosphorylation of chromatin-bound ATM/ATR substrates by staining with anti-pSQ/TQ (59). Cells were incubated in 2 mM HU or vehicle control (water) for 6 hours. Dots represent individual cell lines; mean ± s.d.; inset P values determined by two-way ANOVA.
C, Re-initiation of DNA synthesis following HU-induced replication stress. Cells were incubated with 2 mM HU for 16 hours and moved to fresh growth media for indicated times. BrdU was added 15 minutes prior to fixation to identify S-phase cells. Data reported as percentage of cells that are BrdU+ relative to vehicle-treated control cells.
D, UV-resistant DNA synthesis. S-phase cells were labeled with BrdU prior to UV-irradiation (5 J/m2) or mock-treated. Post-UV DNA synthesis was detected by EdU incorporation. Values reported as relative EdU intensity in BrdU positive cells in UV-irradiated compared to mock-treated cells. N = 3 cell lines per condition. Two-tailed t-test.
E, Percentage of cells with RPA exhaustion in control (CTRL) cells or following 6-hour incubation with HU. See fig. S2C. N = 3 cell lines per condition. Two-way ANOVA.
F, Percentage of cells that are RSR defective measured by ability to complete DNA synthesis after HU-induced replication stress per Fig. 1A, either following suppression of origin firing with 10 μM roscovitine or mock DMSO 2 hours prior to HU treatment and maintained throughout the experiment. N = 3 cell lines per condition. Two-tailed t-test.
G, Quantification of fork restart following HU-induced replication stress in RSRD-high cells either in presence or absence of suppression of origin firing with 10 μM roscovitine. N = 3 cell lines per condition. Two-tailed t-test.
H, Immunostaining for cytosolic ssDNA (green) and nuclei (blue) in RSRD-low (i, MCF-10A; ii, ZR-75–1) and RSRD-high cell lines (iii, BT549; iv, HCC38). Scale bar indicates 10 μm.
I, Quantification of cytoplasmic DNA immunostaining in (H) as integrated ssDNA intensity normalized to DAPI. Two-tailed t-test.
J and K, Quantification of cytosolic ssDNA (J) or dsDNA (K) concentrations, reported normalized to cytosolic protein concentration. Two-tailed t-test.
All data are mean ± s.d. with each dot representing the average value for an individual cell line.
