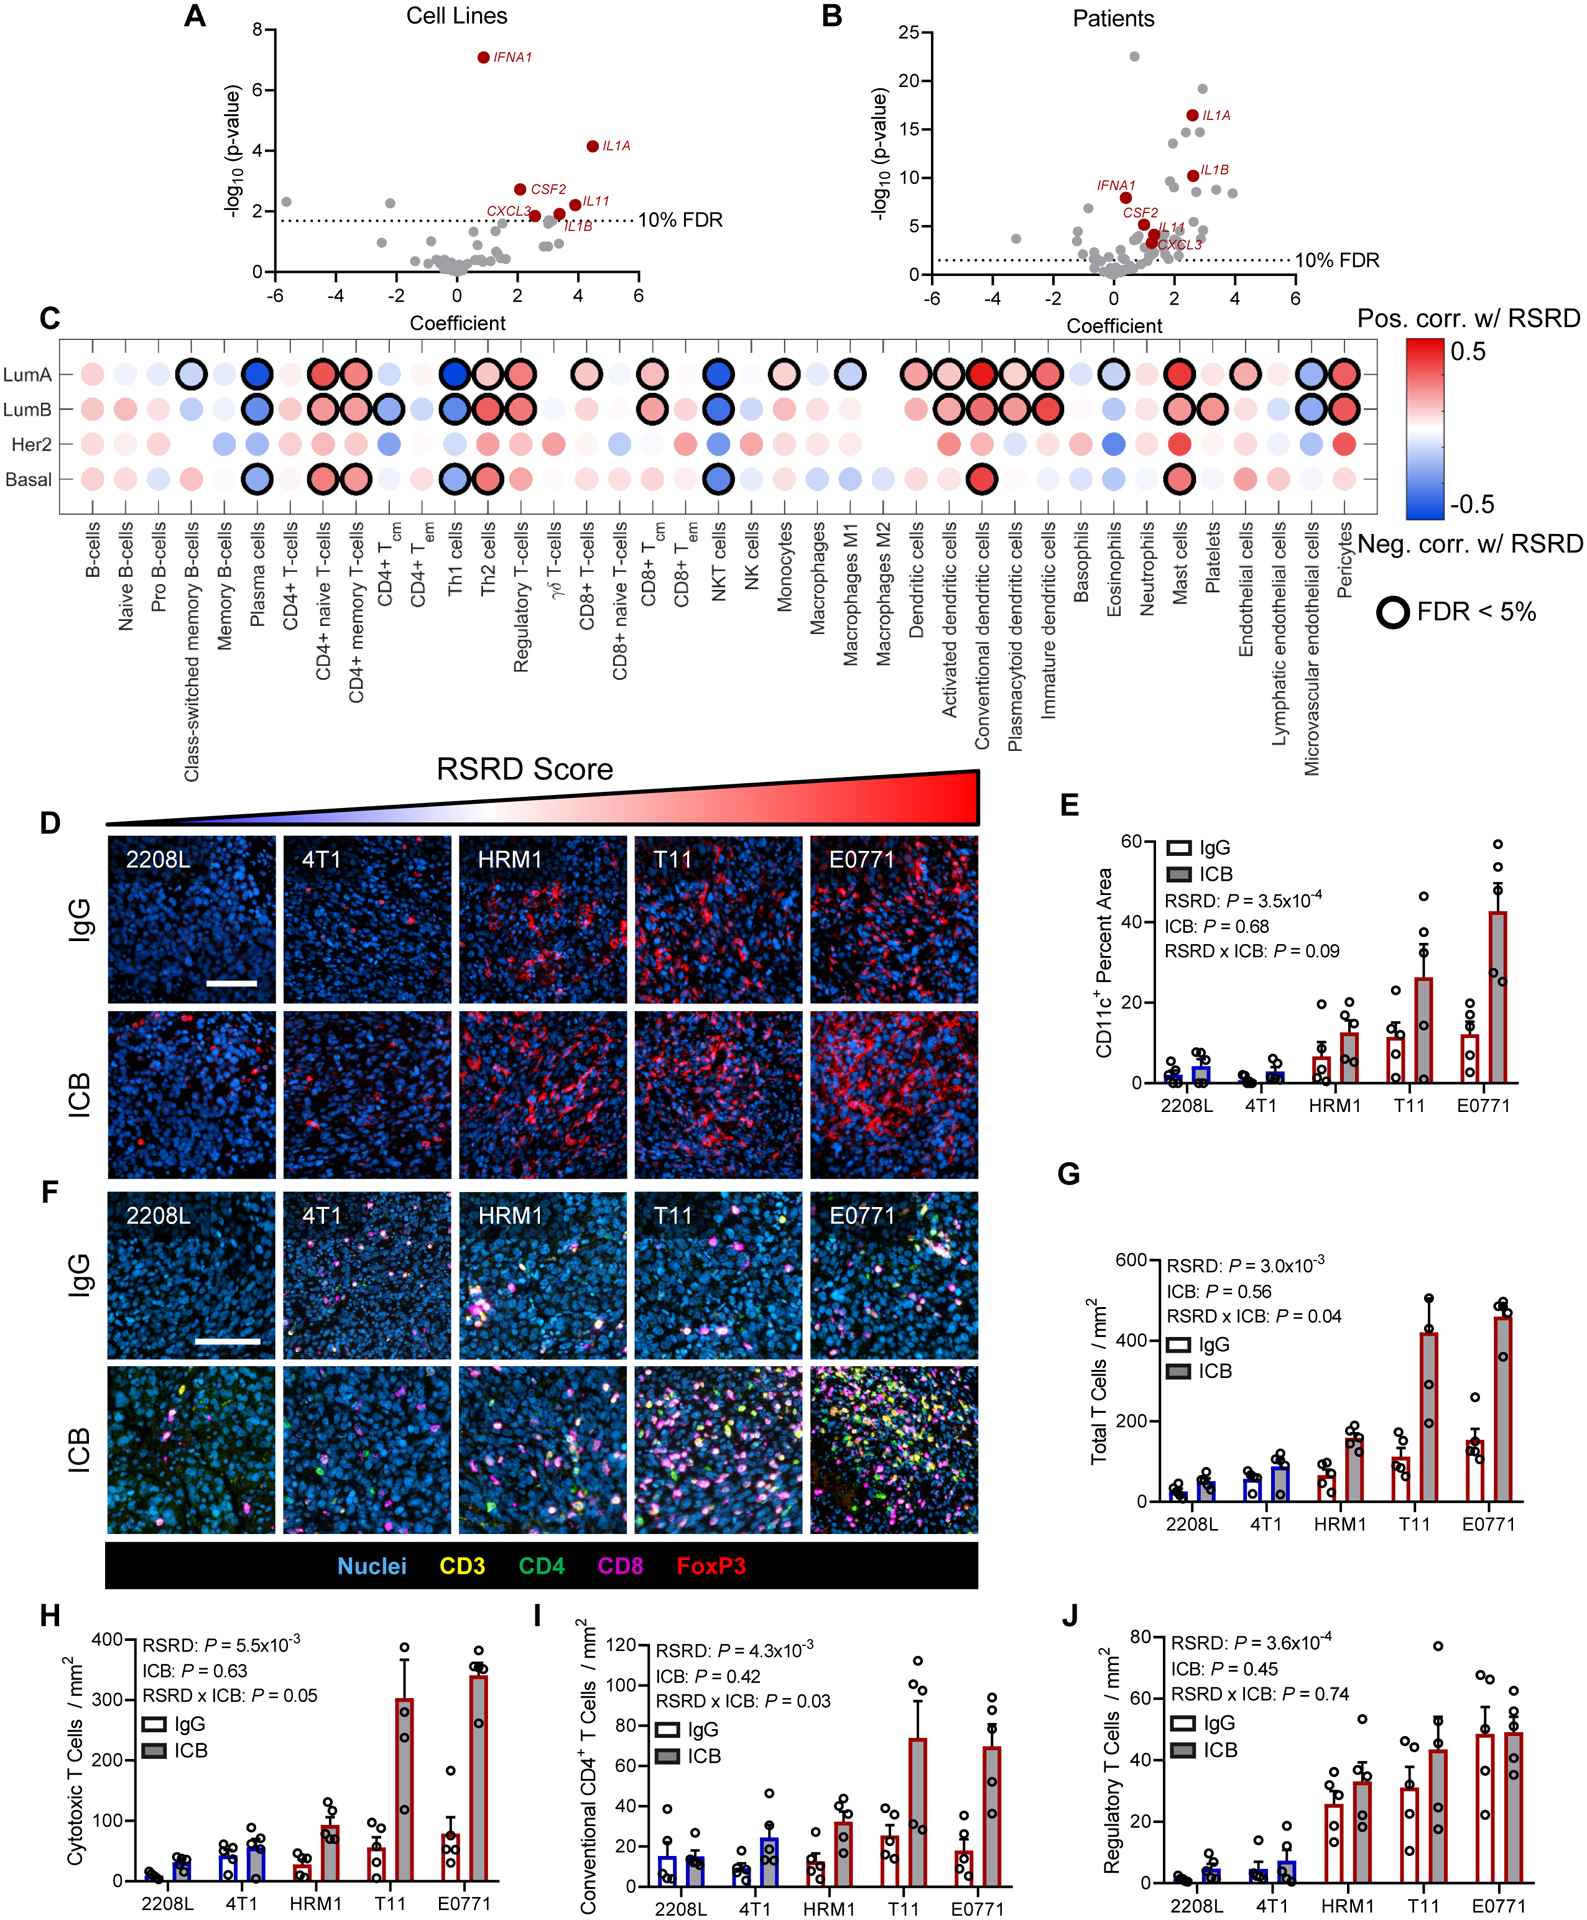
Fig. 5. Immune microenvironment changes in RSRD-high breast cancer.

A and B, Relationship between RSRD score and expression of cytokines/chemokines in breast cancer cell lines (A) and samples from patients with breast cancer from TCGA (B). Highlighted cytokines indicate those significant in both cell lines and patients.
C, In silico immune populations from TCGA patients with breast cancer as determined by xCell. Dot color indicates magnitude of Spearman correlation coefficient. Relationships with an FDR<0.05 are indicated by black circles.
D, Representative images showing nuclei (blue) and dendritic cells (CD11c, red). Scale bar = 100 μm. Mice treated per Figure 3E–I for 10 days. IgG, IgG controls; ICB, immune checkpoint blockade.
E, Quantification of images from D. Dots represent tumors from independent mice (N = 5), values given as mean ± SEM. Significance determined by regression of average value for CD11c area per mouse with RSRD score and treatment status.
F, Representative multispectral images showing nuclei (blue), CD3 (all T cells, yellow), CD4 (CD4 T cells, green), CD8 (cytotoxic T cells, magenta), and FoxP3 (regulatory T cells, red). Scale bar indicates 100 μm. Mice treated per Fig. 3, E to I for 10 days.
G to J, Quantification of multispectral images from F, indicating total T cells (CD3+, G), cytotoxic T cells (CD3+CD8+, H), conventional CD4 T cells (CD3+CD4+FoxP3−, I), and regulatory T cells (CD3+CD4+FoxP3+, J). Dots represent tumors from independent mice (N = 5), values given as mean ± SEM. Significance determined by regression of average population value per mouse with RSRD score and treatment status.
