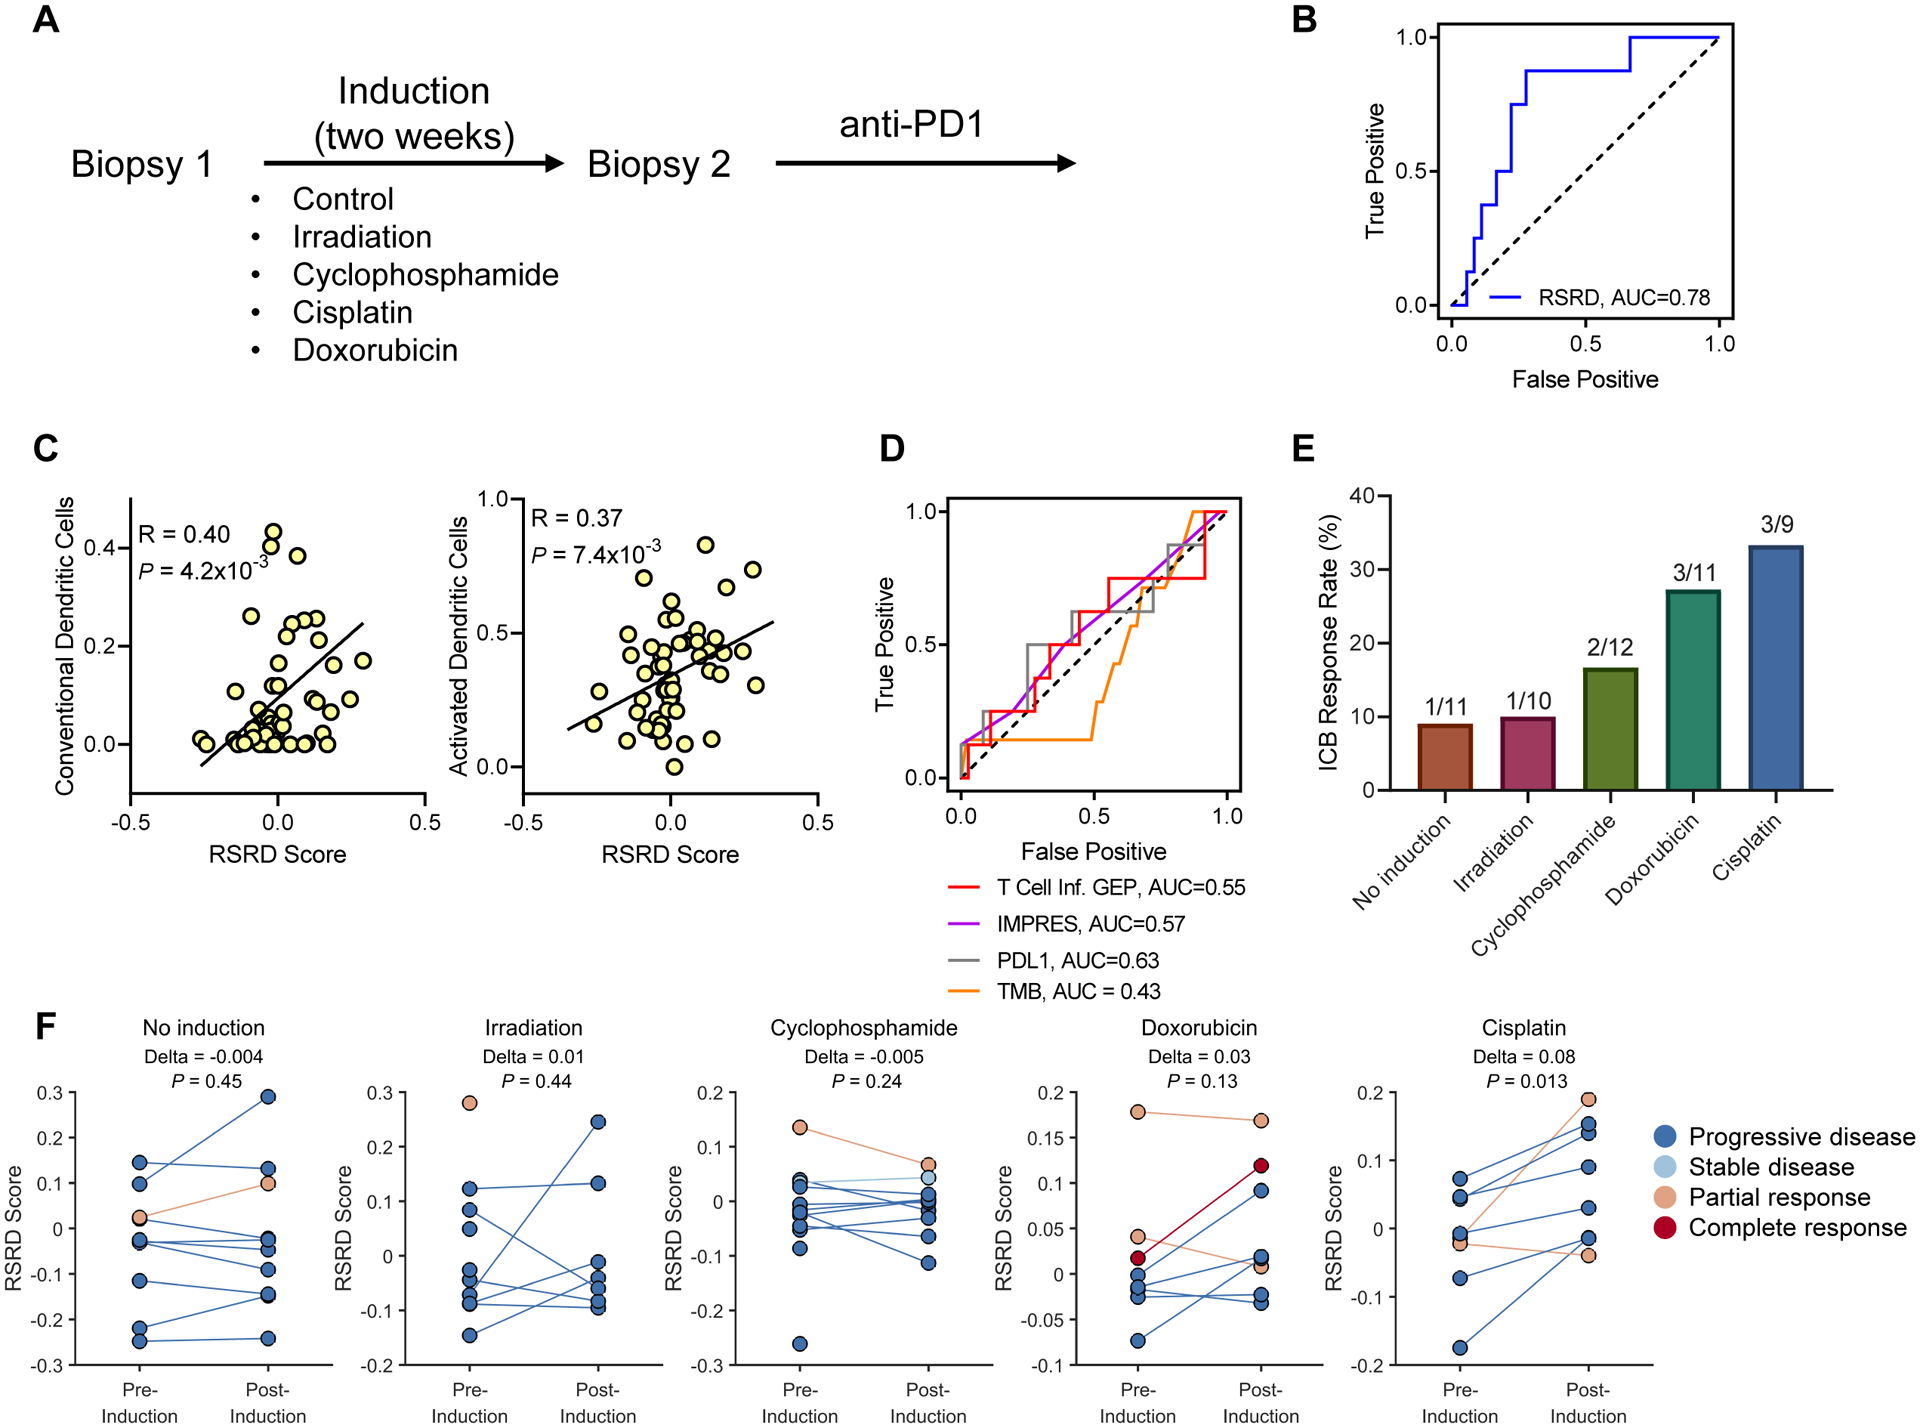
Fig. 6. RSRD score is a dynamic biomarker to predict ICB response in metastatic breast cancer patients.

A, Schematic for metastatic breast cancer TONIC trial design (11).
B, ROC curves demonstrating ability of RSRD score to predict patients who achieved CR/PR/SD for at least 24 weeks following ICB treatment using RNA-seq from latest biopsy available.
C, Correlation of conventional/activated dendritic cells and RSRD score in the TONIC cohort. Spearman correlation coefficient.
D, ROC curves for alternative published ICB response biomarkers T Cell Inflamed (9, 33) gene expression signature, IMPRES (7), PD-L1 expression, and tumor mutation burden.
E, Response rate by induction treatment for patients in TONIC RNA-seq cohort.
F, Change in RSRD score following various induction strategies. Each pair of dots represents an individual patient (or single dots for patients lacking post-induction transcriptional data). Wilcoxon signed-rank test.
