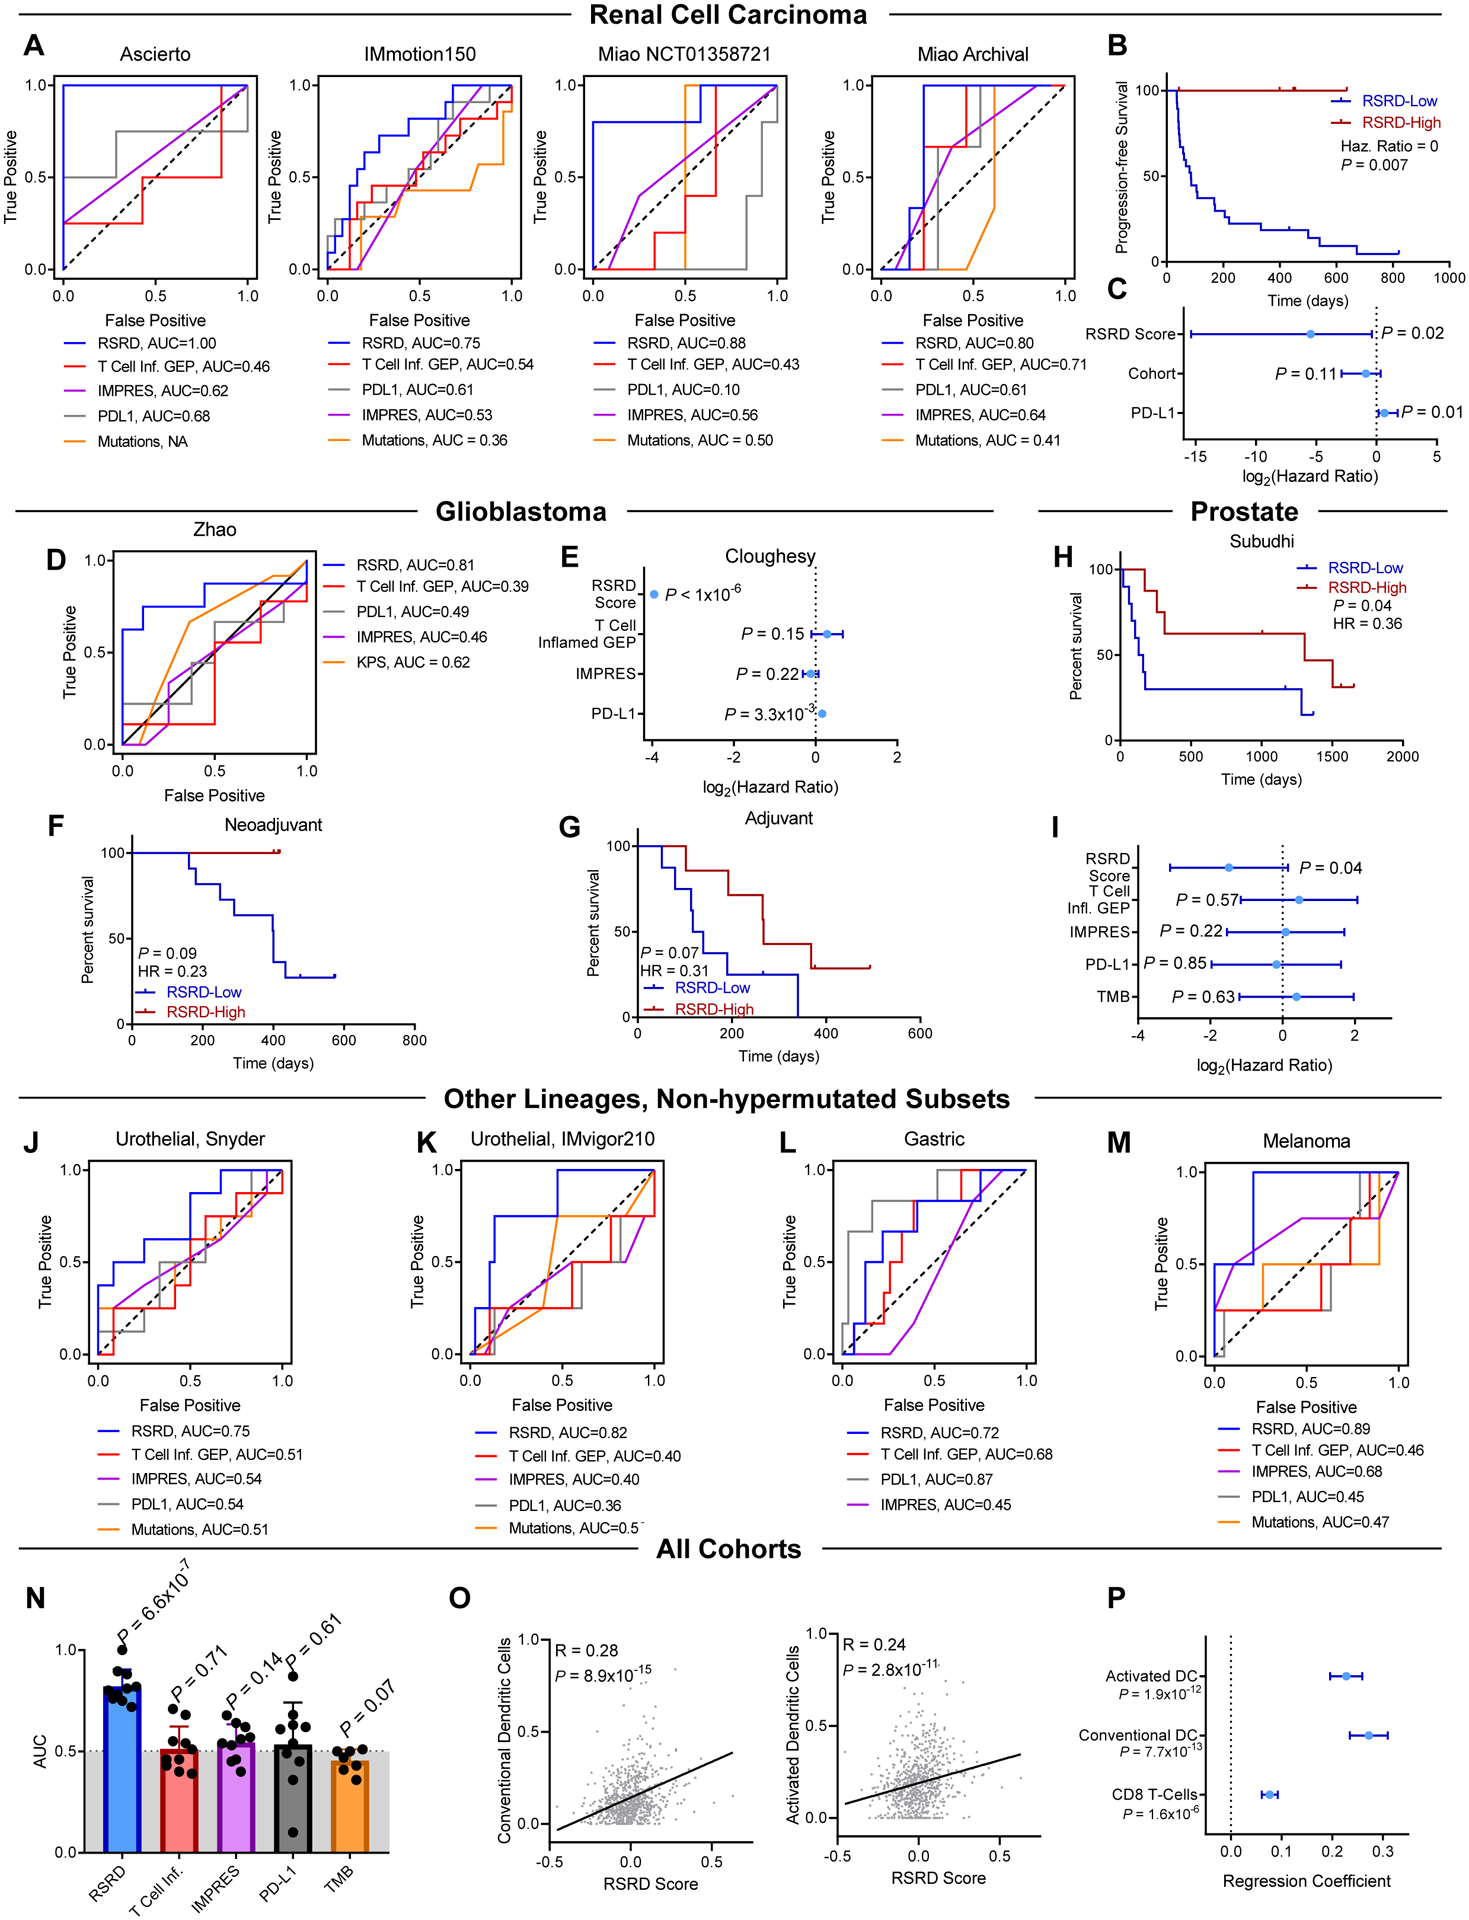
Fig. 7. RSRD score predicts ICB response across multiple cancer types.

Prediction of response to ICB by published biomarkers T Cell Inflamed (9, 33) gene expression signature, IMPRES (7), PD-L1 expression, and mutation burden compared to RSRD score.
A, ROC curves demonstrating prediction of ICB response indicated biomarkers in cohorts of patients with ccRCC (36–38).
B, Progression free survival (PFS) for all in patients from Miao cohorts (37) based on RSRD score. Log-rank P-value.
C, Multivariate analysis of PFS in Miao cohorts (37) accounting for RSRD score, whether patients were treated in the first line, and PD-L1 expression, stratified by NCT1358721 vs archival cohort.
D, ROC curve showing ability of RSRD score to predict response in patients with GBM treated with anti-PD1 from the Zhao (41) cohort.
E, Overall survival analysis of anti-PD1-treated patients with GBM (13), considering treatment in either the neoadjuvant or adjuvant context as a clustering variable. All parameters were treated as continuous variables.
F and G, Kaplan-Meier curves showing overall survival from the Cloughesy (13) cohort treated either in the neoadjuvant (F) or adjuvant (G) context, and stratified by the RSRD score.
H, Overall survival of patients with metastatic prostate cancer treated with anti-CTLA4 stratified by RSRD score (53). Log-rank test.
I, Hazard ratio using overall survival data from (H) for indicated biomarkers. Error bars indicate 95% confidence interval. Log-rank test.
J to M, ROC curves showing ability of RSRD score and other indicated biomarkers to predict ICB response in low mutation subsets of patients with urothelial cancer treated with anti-PD-L1 from (J) Snyder (43) and (K) IMvigor210 (45), (L) patients with gastric cancer treated with anti-PD-L1 (54), and (M) patients with melanoma treated with anti-PD1 (55, 56).
N, Compilation of AUC values across all cohorts from Fig. 6 and 7 for evaluated biomarkers. P value assessed by one-sample t-test to determine significant difference from an AUC of 0.5 indicative of random assignment.
O, Correlation of conventional/activated dendritic cells and all patients treated with ICB. Spearman correlation coefficient.
P, Regression using a generalized linear mixed-effects model of RSRD score as a function of conventional dendritic cells, activated dendritic cells, or CD8 T-Cells. Patient cohorts were treated as a random effect. Regression coefficient with standard error.
