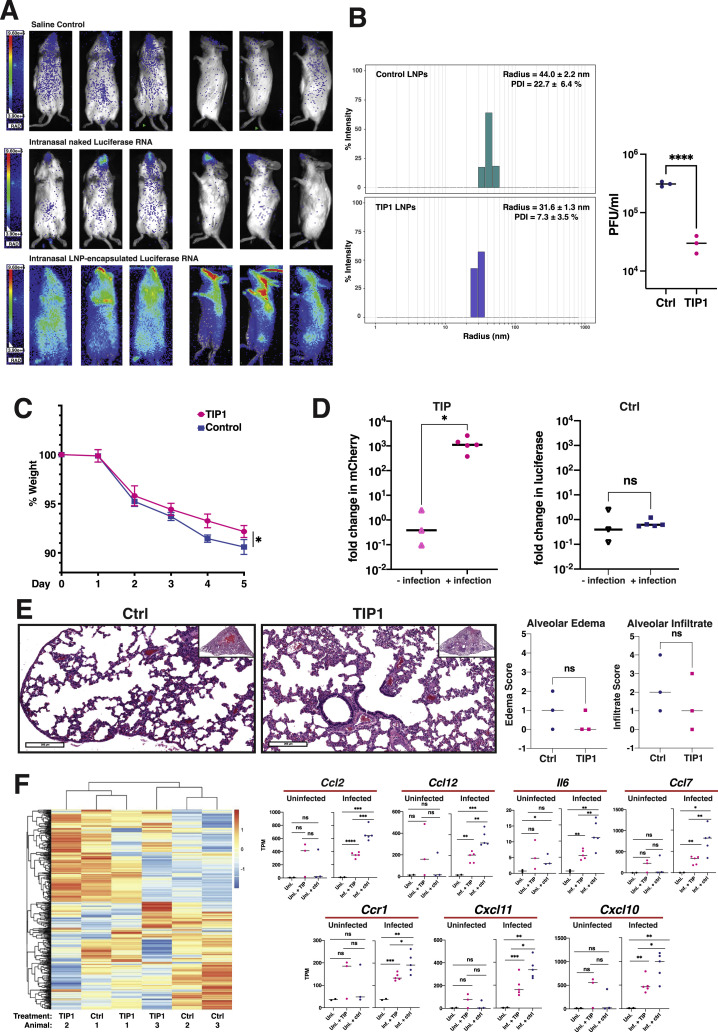
Figure S4.
Characterization of lipid nanoparticles (LNPs) for intranasal delivery and analysis of LNP TIPs in infected and uninfected hamsters, related to Figure 7
(a) Bioluminescence imaging of mice six hours after intranasal administration of in vitro transcribed RNA encoding firefly luciferase. Mice were given either saline, purified RNA alone (‘naked RNA’), or LNP-encapsulated RNA. (b) Left: Dynamic light scattering (DLS) characterization of LNPs carrying TIP RNA to measure radius and polydispersity (left). Right: Validation of antiviral activity (yield reduction) of LNP TIPs in infected Vero cells. Confluent cells were incubated for two hours with TIP LNPs or Ctrl LNPs (at an RNA concentration of 0.3ng/μL) and cells were then infected with SARS-CoV-2 (MOI = 0.05). Supernatant was harvested at 48 hours post infection and virus titered by plaque assay (PFU/ml). (c) Weight change of hamsters over time after infection with SARS-CoV-2 in Ctrl- or TIP LNP treated animals. (d) Quantification of TIP and Ctrl RNA in the presence and absence of infection in hamsters. Syrian golden hamsters were treated twice with TIP or Ctrl RNA at 24hrs apart in the presence and absence of SARS-CoV-2 (106 PFU). Lungs were harvested at day 5, RNA was extracted, and qRT-PCR was performed for either mCherry or luciferase. Quantification of TIP and Ctrl RNAs was performed between the infected and uninfected lung samples. (e) H&E staining of lung section of one representative Ctrl-treated and one representative TIP-treated animal in the absence of infection at 5 days post treatment (left). Histopathological scoring of lung sections from the uninfected hamsters (n = 3 for each group of animals) treated with TIP or Ctrl RNA LNPs for alveolar edema and cellular infiltrates to alveolar space (right).(f) Heatmap showing expression level of DEGs in uninfected samples. DEGs were defined by comparing infected samples treated with TIP or Ctrl RNA LNPs. Representative proinflammatory genes are shown on the right in the presence and absence of infection. [For all panels: ns denotes not significant, ∗∗∗∗ denotes p < 0.0001 ∗∗∗ denotes p < 0.001, ∗∗ denotes p < 0.01, ∗ denotes p < 0.05 from Student’s t test].

