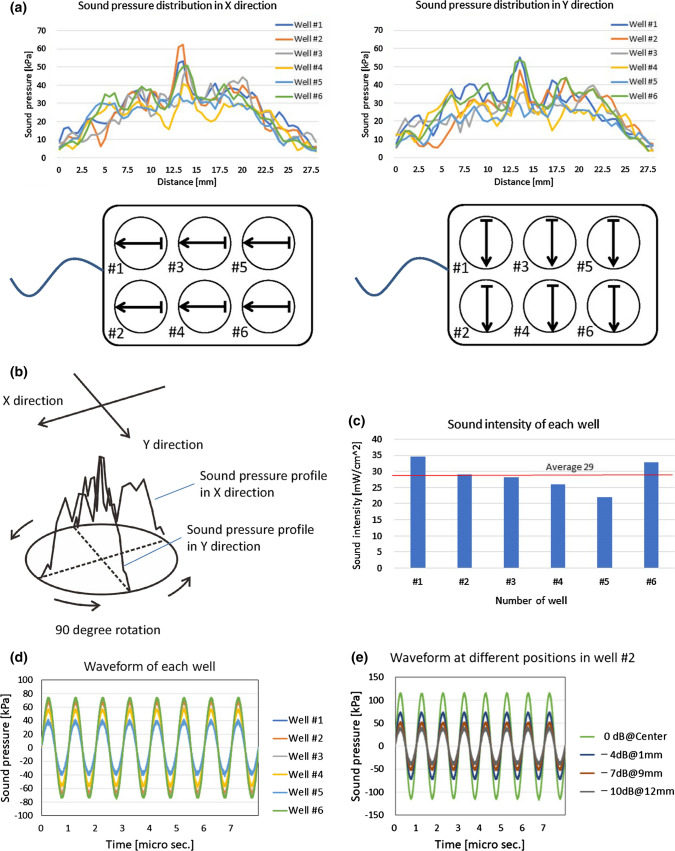
Fig. 4.
a The sound pressure distributions in the X and Y directions. b The total energy of US irradiation in each well was obtained by the rotation manner from the measured sound pressure profiles in both the X and Y directions as shown in Fig. 4b. ISATA was calculated as the total energy divided by the bottom area of the well. c Calculated sound intensity of each well. The average in the 6-well plate is 29 d The sound pressure waveform is observed at the center of each well. The waveforms are substantially sinusoidal. e The waveform at different positions (the center of the well and the peripheral positions) in the well. Every waveform even at different positions is also substantially sinusoidal

