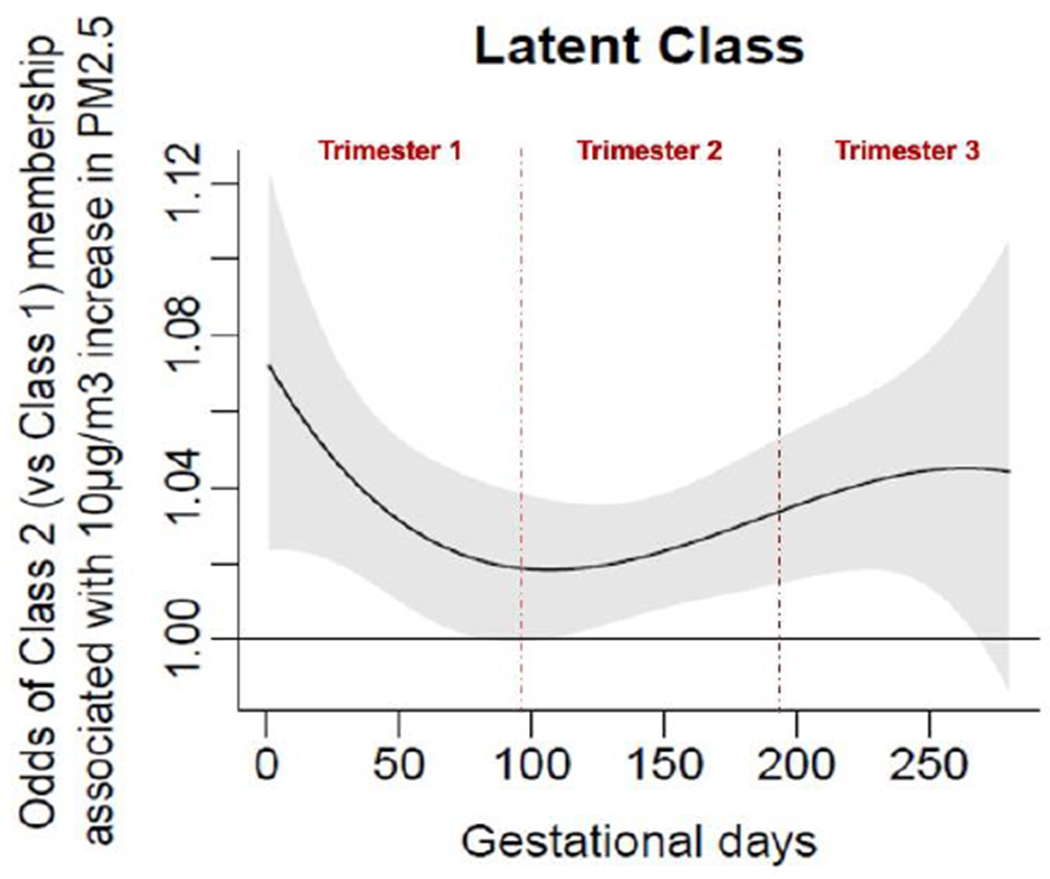
Figure 4.

Associations of daily prenatal PM2.5 levels to odds ratio of membership in Class 2 (vs Class 1. Class 1 = High Performance (Reference) Group. Class 2 = Low Performance Group. X-axis represents days of gestation and y-axis shows changes in odds of Class 2 membership (relative to Class 1) associated with a 10μg/m3 increase in PM2.5 exposure. Black lines graph the expected change in odds of Class 2 membership at each day of gestation; gray shadings show pointwise 95% CIs. A critical window (CW) is defined as a range of days over which the 95% CI excludes zero.
