Figure 1.

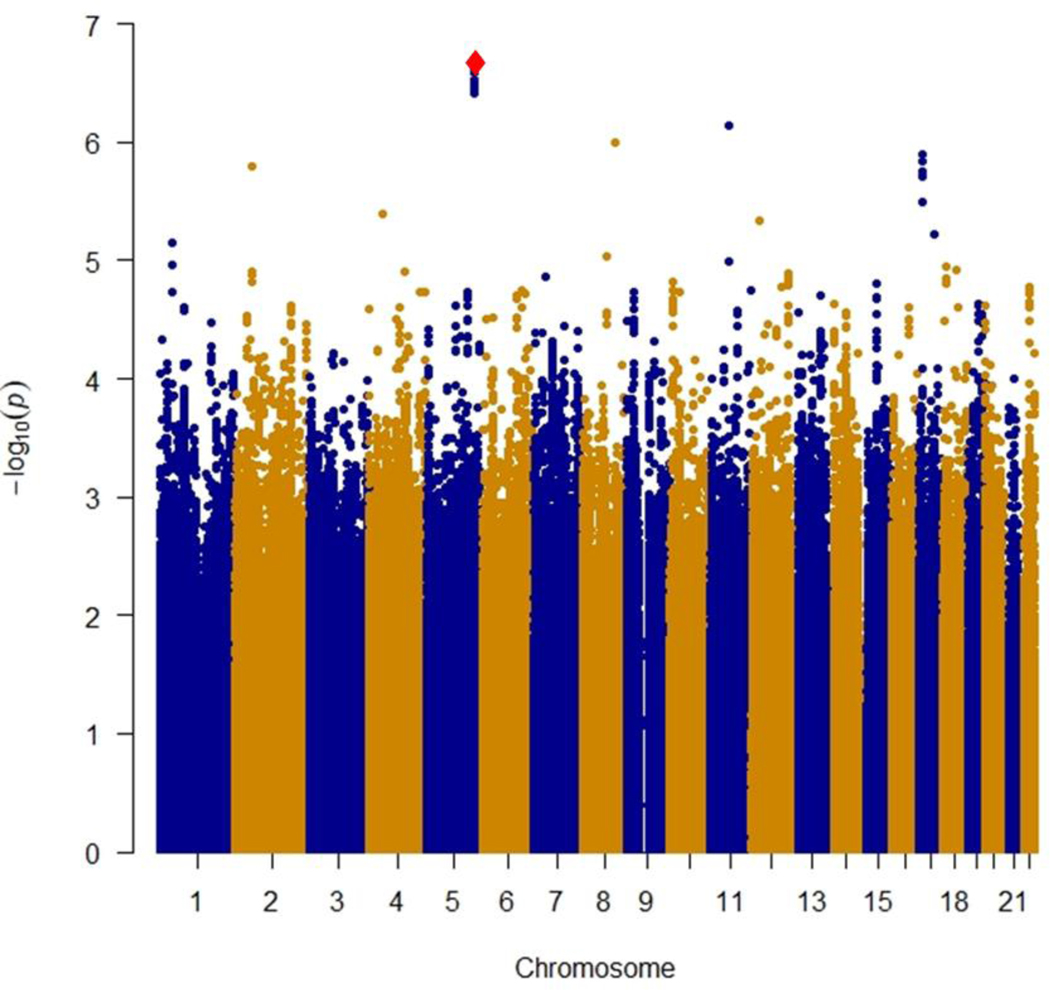
A): Manhattan plot of near-significant loci associated with primary non-response to anti-TNFα biologics in the discovery cohort
Single-nucleotide polymorphisms (SNPs) are plotted on the x-axis according to their positions on each chromosome against association with primary non-response to anti-TNFα biologics on the y-axis (−log10P value). Near-significant associations were observed in chromosome 5 [Genome-wide significant threshold: P = 5.0 × 10⁻⁸]. The diamond identifies our most significant SNP association (rs34767465).
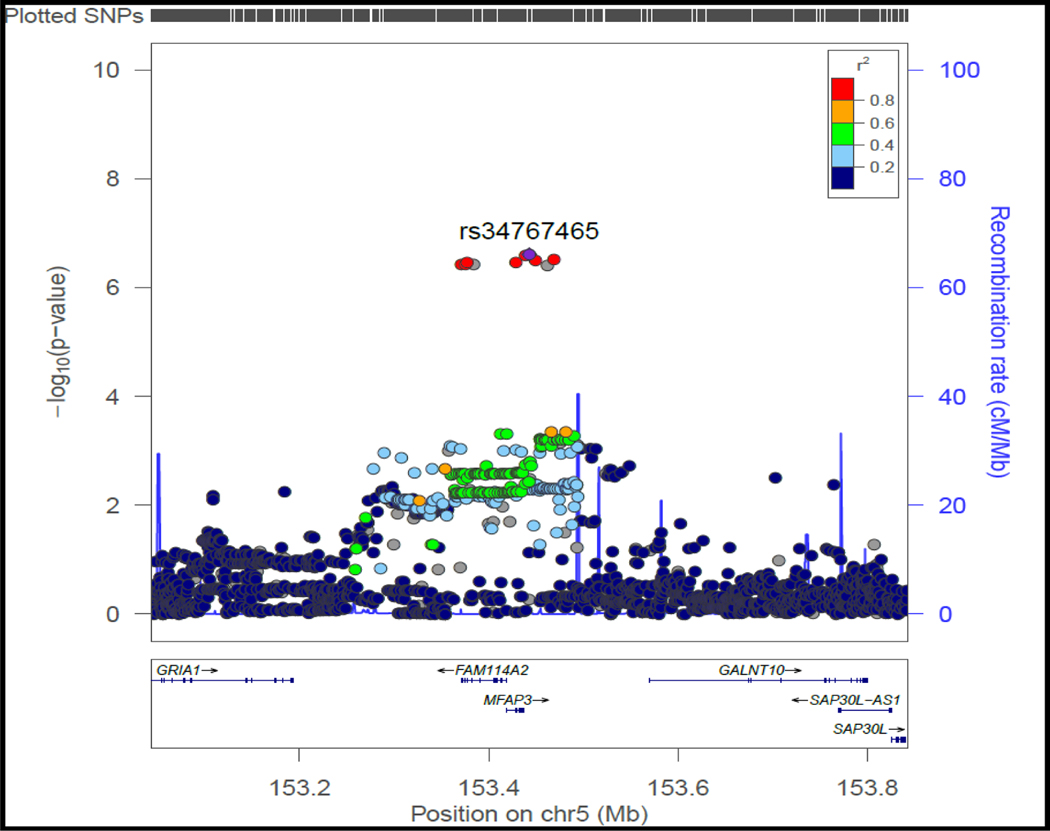
B): Locus-specific plot of rs34767465 on chromosome 5
The x-axis represents the genomic position in chromosome 5 and the left y-axis represents the –log10P of association with primary non-response to anti TNF∝ biologics in the discovery cohort. The colors of the circles denote linkage disequilibrium (r2) between rs34767465 and nearby SNPs (based on pairwise r2 values from the 1000 Genomes Project European population). The right y-axis show the estimated recombination rate (obtained from HapMap). Genes at this locus are indicated in the lower panel of the plot. Chromosomal positions are based on hg19 genome build.
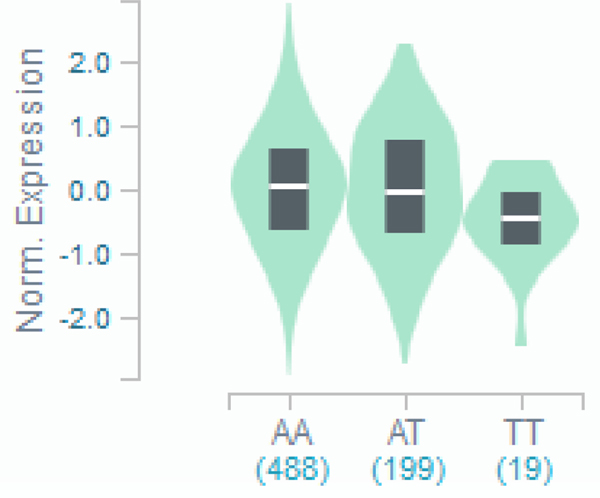
C): Violin plot of FAM114A2 expression for cis eQTL rs34767465 in Genotype-Tissue Expression (GTEx, release v7)
The allelic effect of rs34767465 on normalized FAM114A2 gene expression levels are shown by boxplots within violin plots. [Normalized effect size = −0.15, p = 0.0000027]. A and T alleles indicate the major and minor allele types, respectively with the number of subjects shown under each genotype. The plots indicate the density distribution of the samples in each genotype. The white line in the box plot (black) shows the median value of the gene expression at each genotype.


