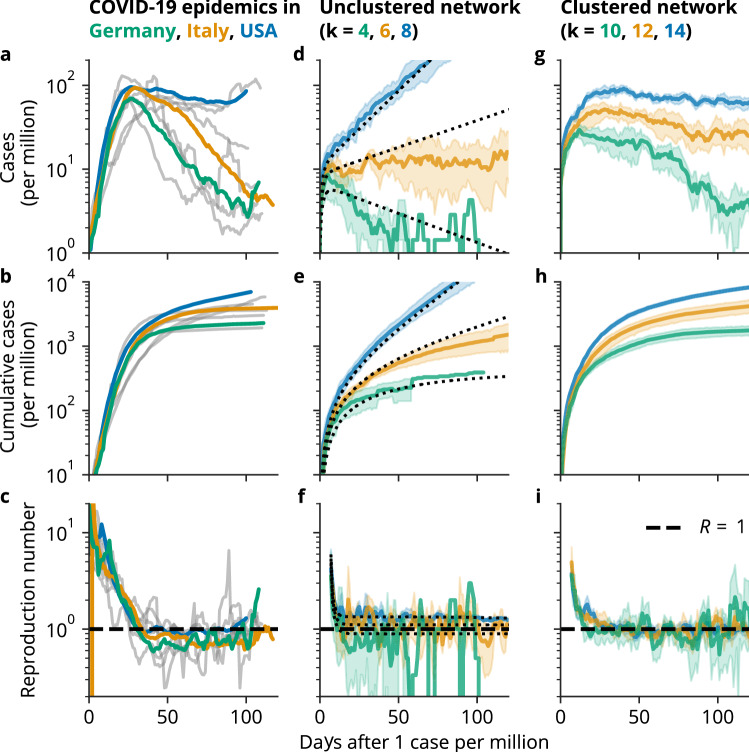
Figure 1.
Dynamics of COVID-19 epidemics compared to model dynamics in hypothetical clustered and unclustered networks. (a–c) Seven-day rolling average of new cases per million, cumulative cases per million and reproduction number in Germany, Italy and the US, aligned to the time point when the 7-day rolling average reached one per million. After the implementation of NPIs, case numbers decrease slowly, corresponding to effective reproduction numbers of just below one. As an extreme example, in the US, case counts stayed almost constant for approximately 2 months, before increasing again. In contrast, in Germany, cases decreased by about 90% in 2 months, similar to other Western European countries (gray lines). Case counts in Italy, the epicenter of the first wave, are between those of the US and Germany. (d–f) Disease dynamics in a random network. The number of new cases and cumulative cases changes exponentially over time, strongly depending on the number of contacts and the infection probability. The reproduction number is equal to one only for a fine-tuned set of parameters. Black dotted lines correspond to predictions of the respective differential equation approximation. (g–i) Disease dynamics in a strongly clustered small-world network (). After an initial exponential increase in cases, the number of new cases is almost constant over time, corresponding to a linear increase in cumulative cases and reproduction numbers around one. This behavior is robust against changes in the total number of contacts k and the infection probability . (d–i) show mean and standard deviation of 5 independent simulations per parameter set on Watts–Strogatz networks with nodes. The data in (a–c) is provided by Johns Hopkins University28.

