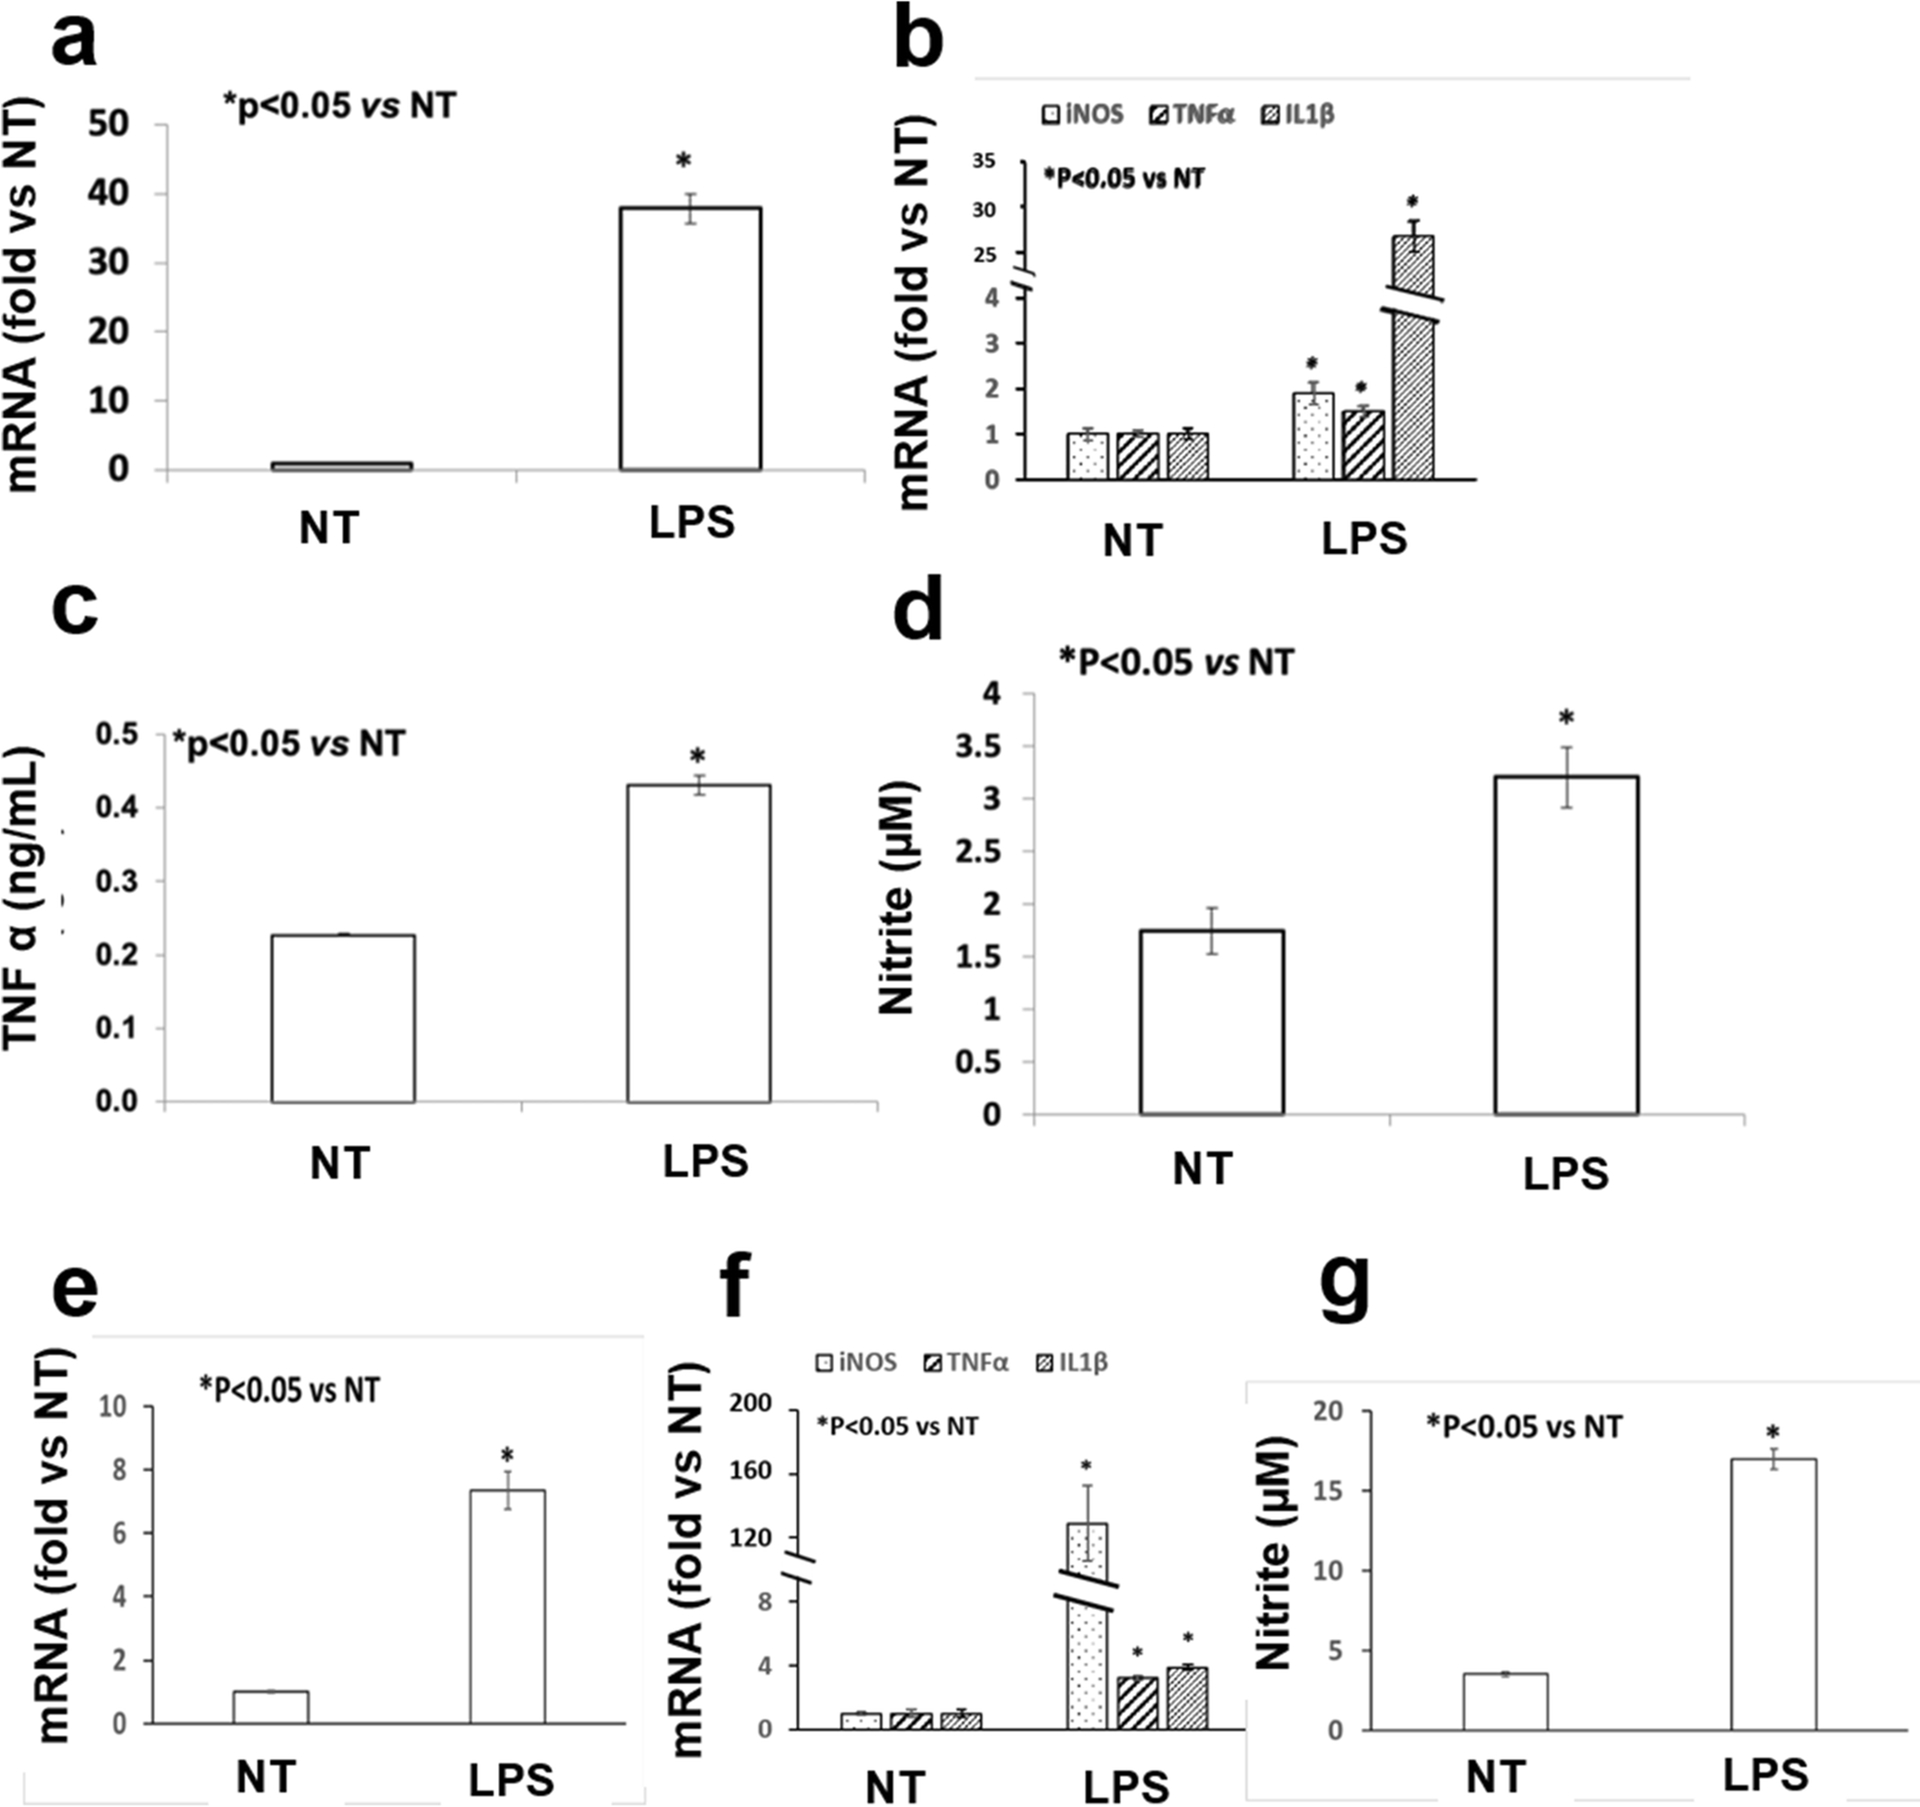
Fig. 1. LPS stimulated Fpr1 expression and inflammatory responses in mouse peritoneal macrophages (PMs, a–d) and bone marrow macrophages (BMMs, e–g).

Both PMs and BMMs were treated by 100 ng/mL LPS for 24 h (LPS group) or not (NT group). Cellular mRNA levels of Fpr1 (a, e) and other inflammatory genes including iNOS, TNF α and IL1β (b, f) were measured by the quantitative RT-PCR. The production of TNF α and the nitrite level in the medium were determined by the ELISA kit and Griess reagent, respectively. Four repeats were done for each group in all experiments and each experiment was duplicated.
