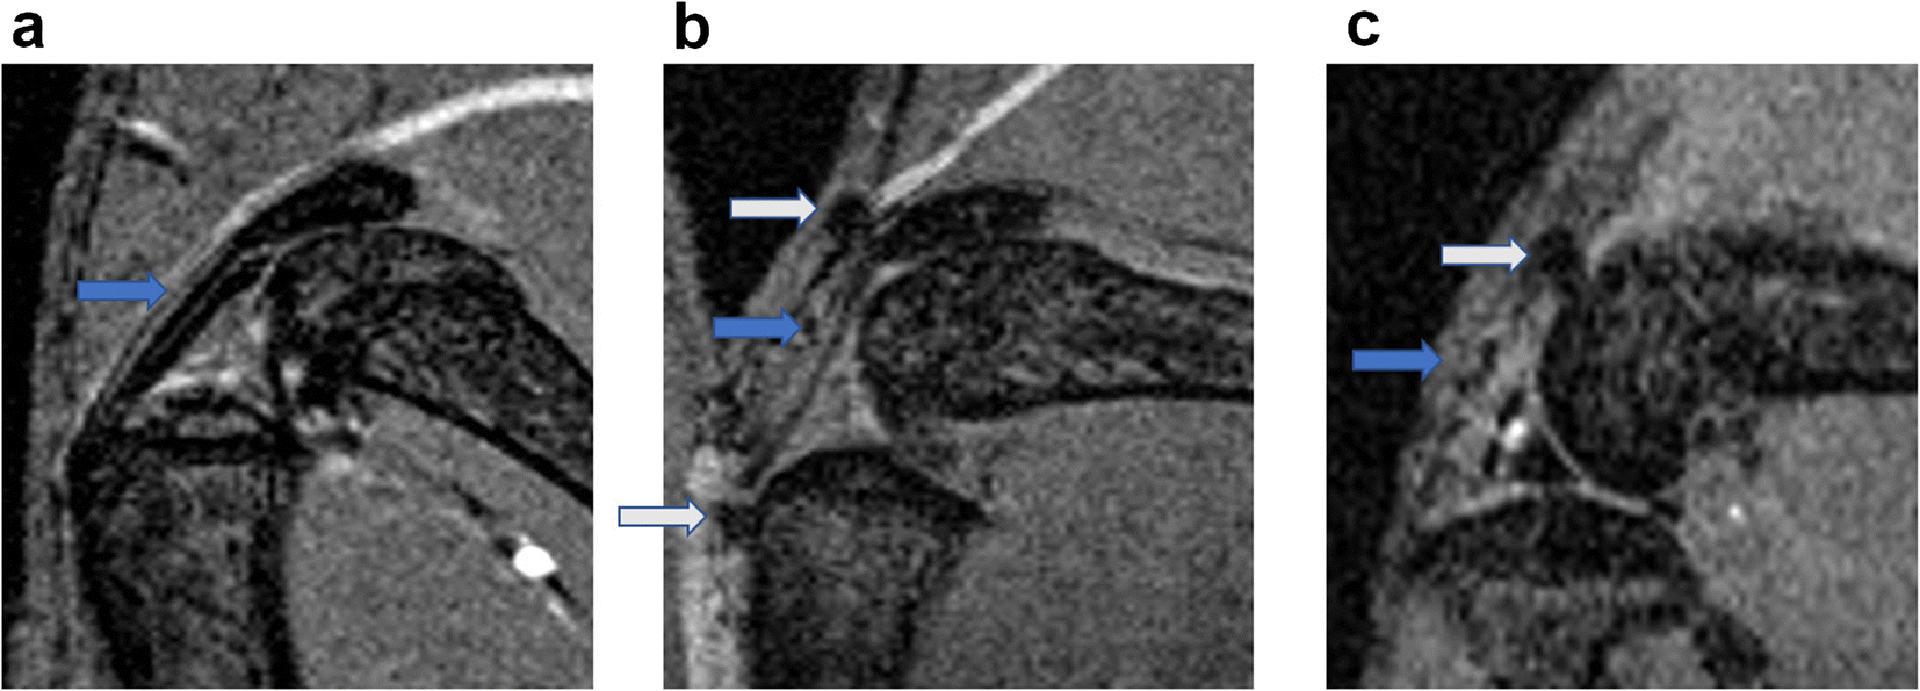
Fig. 3. Representative MRI images of mouse knee joints at week 4 after ACLT surgery.

Compared to the sham joints (a), osteophytes were found at different sites of the ACLT joints (b, c), including patella tendon (marked by grey arrow in b), tibia (marked by grey arrow in b) and femur (marked by grey arrow in c).
