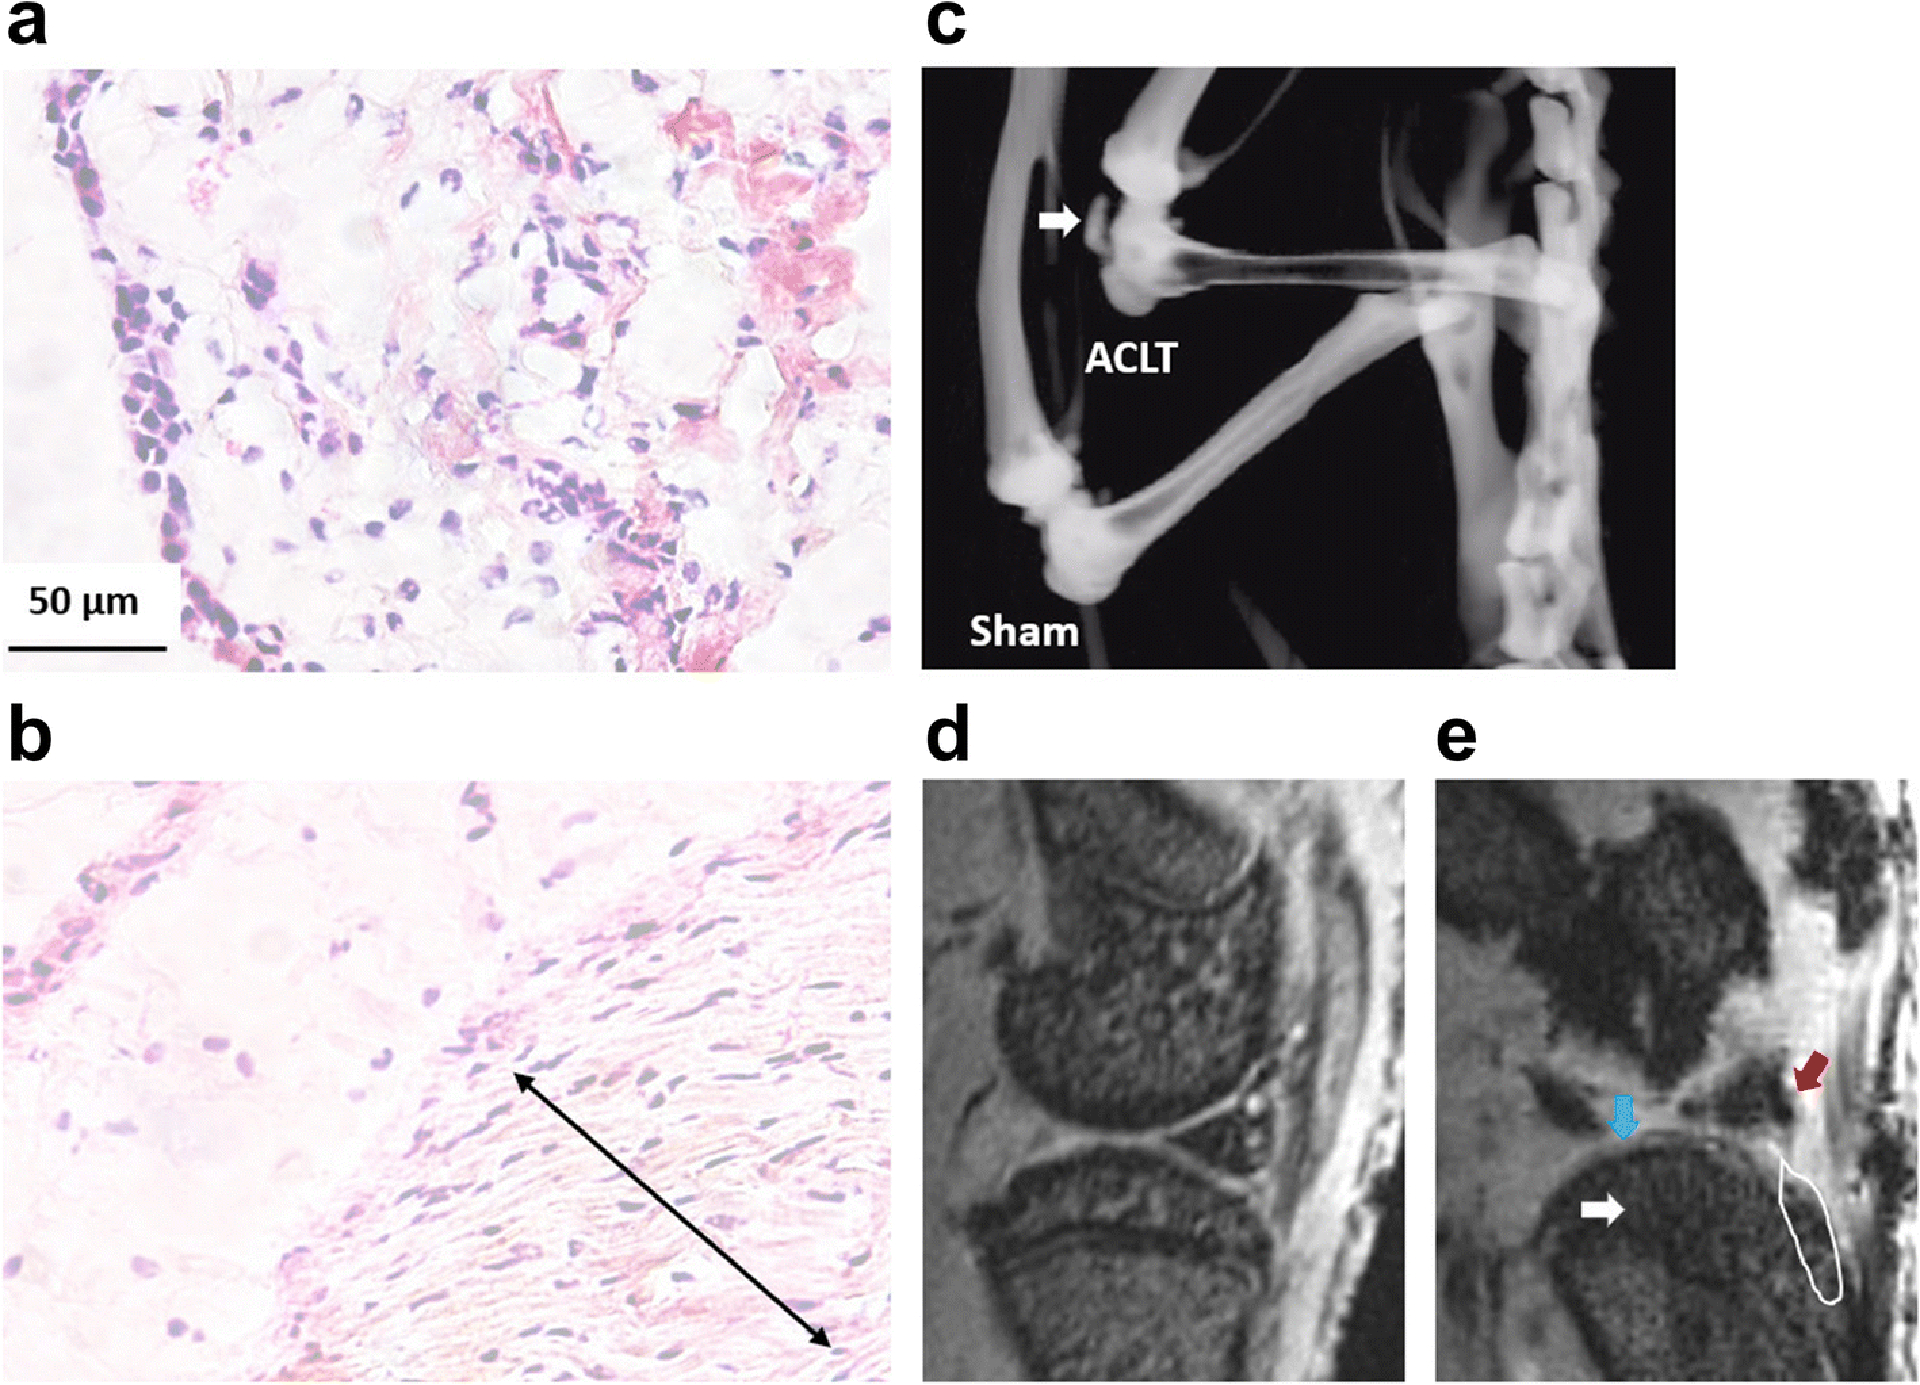
Fig. 4. Representative images of HE staining of the synovial membrane at month 2 (a, b), as well as microCT (c) and MRI (d, e) analysis at month 3 after ACLT surgery in rat.

The degenerative changes were seen in the ACLT knee (b, e) compared to the sham knee (a, d), including formation of fibroblast-like cell enriched regions (double arrow in b) within the synovial membrane, osteophyte formation within the joint (white arrow in c and white line frame in e), and structural damages in tibia cartilage (blue arrow in e ), meniscus (red arrow in e) and tibia subchondral bone (white arrow in c).
