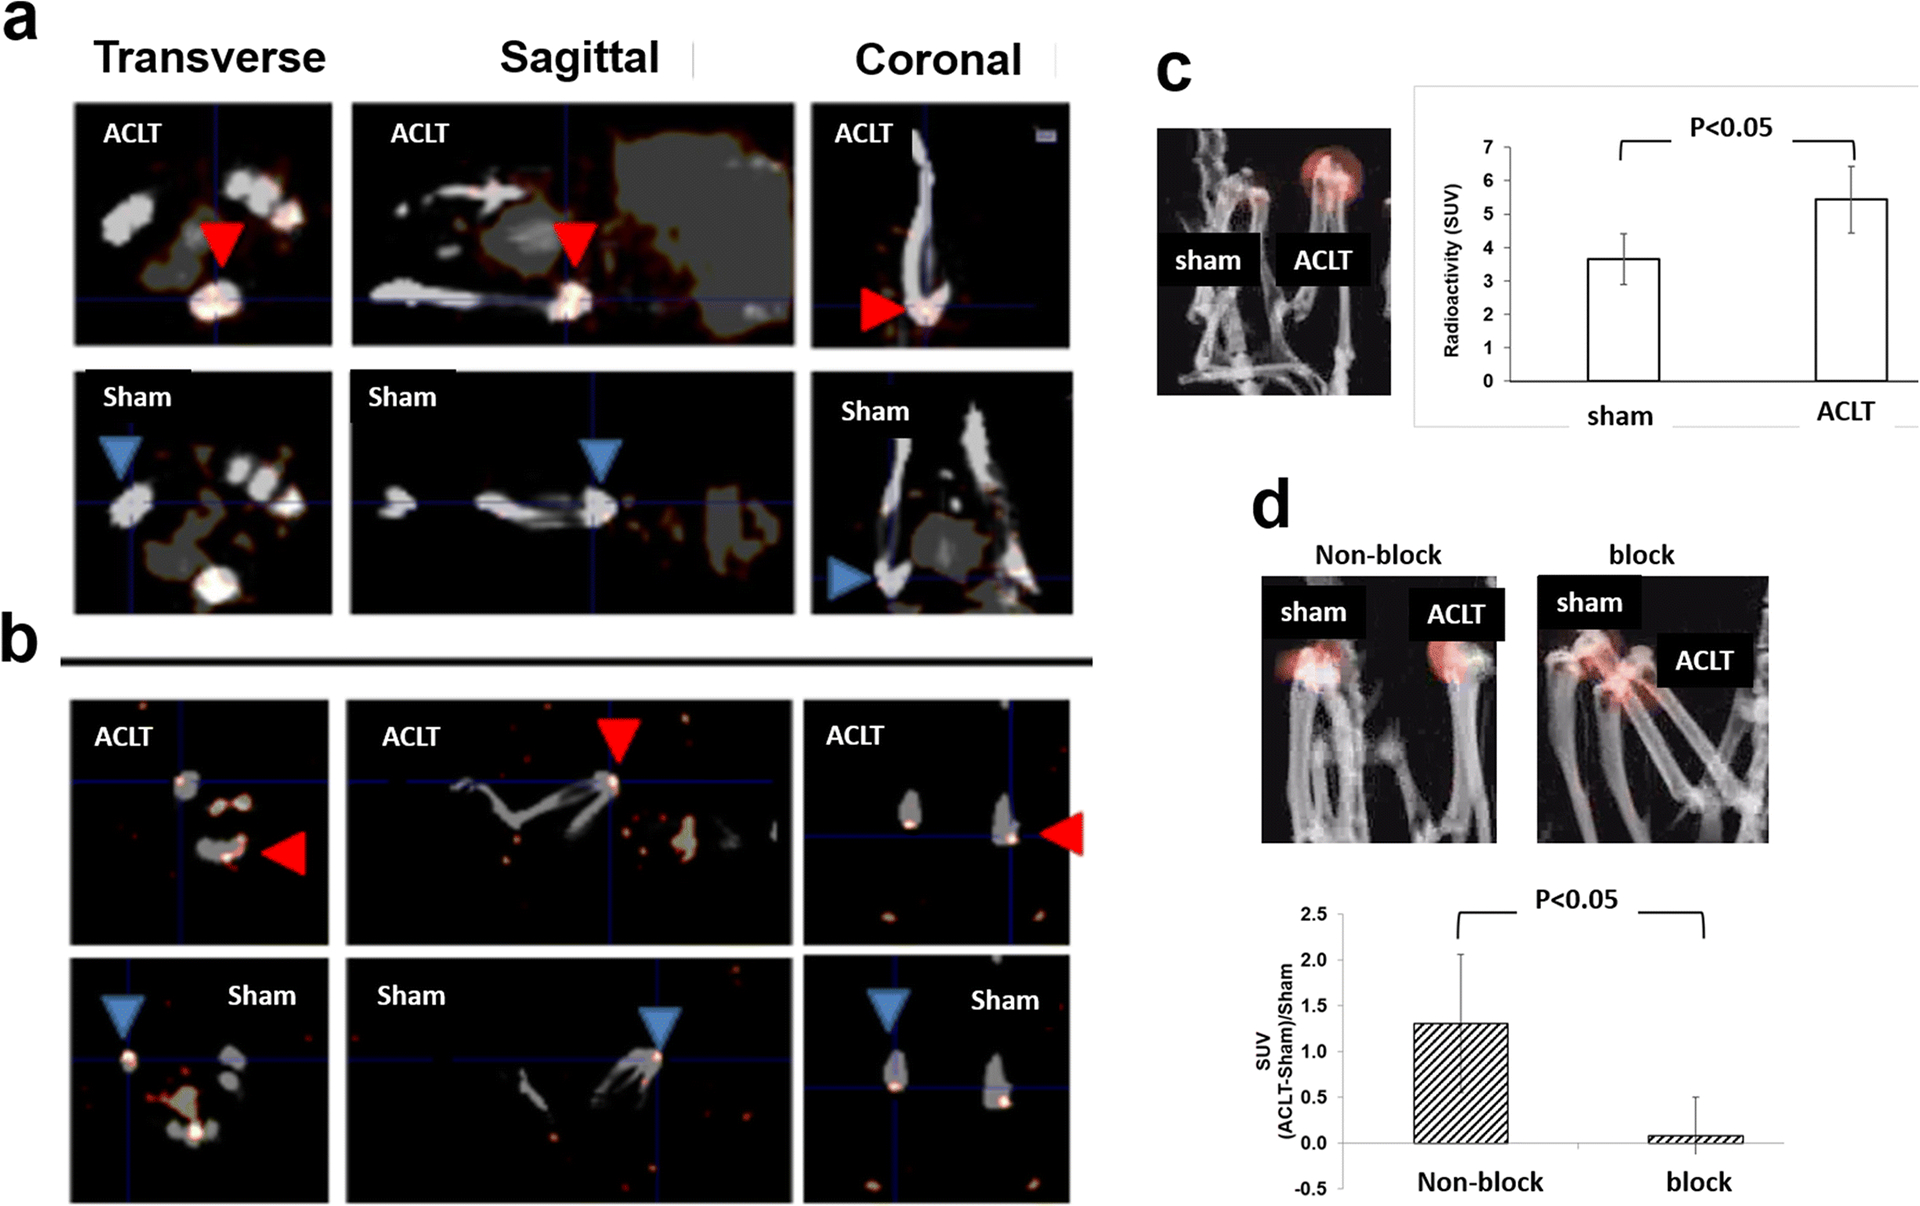
Fig. 5. SPECT signals within the knee joints of mice with ACLT surgery and sham operation using [99mTc]cFLFLF.

Representative 2D SPECT images show that ACLT surgery produced much stronger signal (red arrowhead) from the probe than the sham (blue arrowhead) at week 2 (a) and 11 (b) post-surgery. In addition, the SPECT signals from 4 mice/group were quantified at week 1 (c) and 5 (d) post-surgery, and a representative reconstructed 3D image is also displayed from each group.
