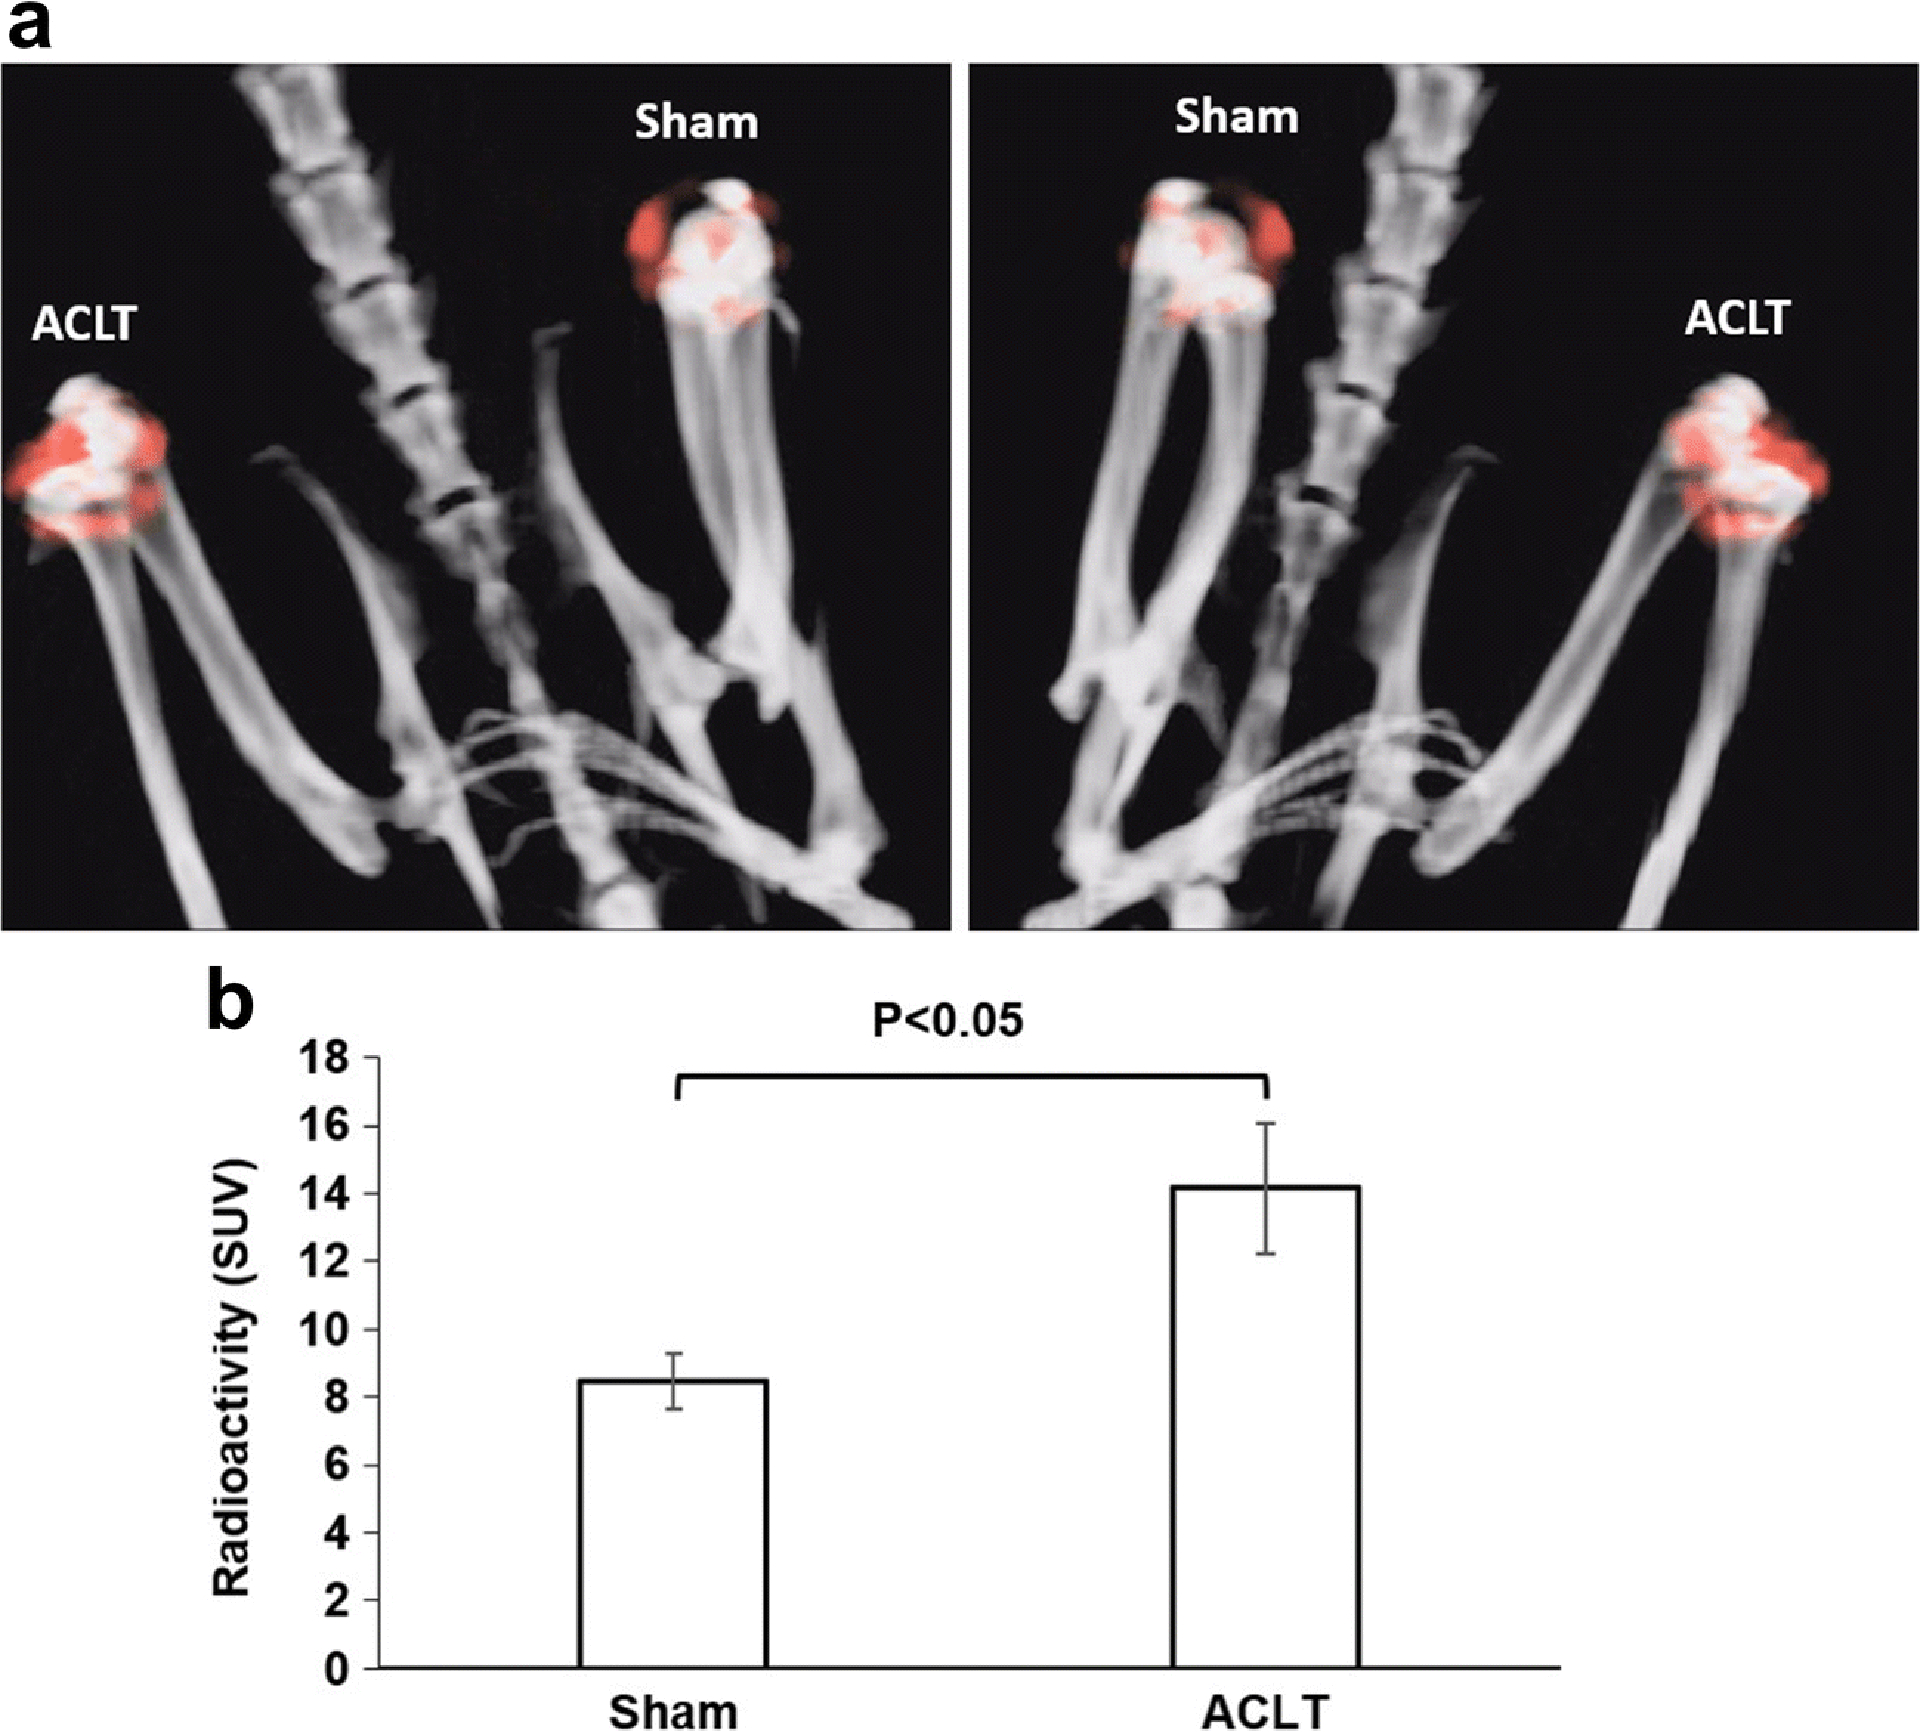
Fig. 6. SPECT signals within the knee joints of rats with ACLT surgery and sham operation using [99mTc]cFLFLF.

SPECT/CT was performed using the probe cFLFLF-PEG-99mTc at 7 weeks after surgery. (a) Representative reconstructed 3D images from one animal. The left and right images show views of one rat at two opposite locations. (b) Quantitative analysis of the SPECT signals determined by the standard uptake values (SUV) from 4 rats.
