Abstract
Objectives
The aim of this study was to investigate the effect of daptomycin against methicillin-resistant staphylococci (MRSA and MRSE) bacteremia using computer modeling.
Methods
A pharmacokinetic/pharmacodynamic (PK/PD) modeling strategy to explain the data from an in vitro dynamic model employing time-kill curves for MRSA and MRSE was proposed. Bacterial killing was followed over time by determining viable counts and the resulting time-kill data was analyzed. Monte Carlo simulations were performed using pharmacokinetic parameters and pharmacodynamic data to determine the probabilities of target attainment and cumulative fractions of response in terms of area under the concentration curve/minimum inhibition concentration (MIC) targets of daptomycin. Simulations were conducted to assess the reduction in the number of colony-forming units (CFU)/mL for 18 days of treatment with daptomycin at doses of 6, 8, and 10 mg/kg/24 h or 48 h with variations in creatinine clearance (CLCR): 15–29 mL/min/1.73 m2, 30–49 mL/min/1.73 m2, 50–100 mL/min/1.73 m2, as well as for defining the probability of reaching the target fAUC/MIC = 80 in the same dose and clearance range. A PK/PD model with saturation in the number of bacteria in vitro, growth delay, and bacterial death, as well as Hill’s factor, was used to describe the data for both MRSA and MRSE.
Results
Monte Carlo simulations showed that for MRSA there was a reduction > 2 log CFU/mL with doses ≥ 6 mg/kg/day in 75th percentile of the simulated population after 18 days of treatment with daptomycin, whereas for MRSE this reduction was observed in 95th percentile of the population.
Conclusions
The presented in vitro PK/PD model and associated modeling approach were able to characterize the time-kill kinetics of MRSA and MRSE. Our study based on PTAs suggests that doses ≥ 6 mg/kg/day of daptomycin should be used to treat bacteremia caused by MRSA and MRSE in patients with CLCR of 15–29 mL/min/1.73 m2. For patients with CLCR ≥ 50 mL/min/1.73 m2, it would be necessary to employ a dose of 10 mg/kg/day to treat complicated bacteremias.
Keywords: Bacteremia, Daptomycin, PK/PD modeling, Monte Carlo simulation
Introduction
Bacteremia is characterized by the presence of microorganisms with pathogenic potential in the bloodstream. The main bacteremia agent among Gram-positive microorganisms is Staphylococcus aureus, highlighting the increasing incidence of cases by methicillin-resistant Staphylococcus aureus (MRSA) strains, reaching values around 54.6%, associated with higher mortality rates (39%) due to bloodstream infections [1]. On the other hand, methicillin-resistant S. epidermidis (MRSE) is the most commonly isolated microorganism in hospital bloodstream infections (30%), especially in critically ill patients who are immunocompromised, and premature newborns admitted to neonatal intensive care units [2, 3].
Potent bactericidal antibiotics are needed for the treatment of MRSA and MRSE infections. Daptomycin is a cyclic lipopeptide antimicrobial that has restrictive activity against Gram-positive microorganisms, being used mainly for the treatment of MRSA, vancomycin-resistant enterococci, and glycopeptide-resistant or intermediate S. aureus, in addition to coagulase-negative staphylococci [4, 5]. Among coagulase-negative staphylococci, S. epidermidis is the most prevalent, being isolated in 50–70% of bacteremia cases, mainly in catheters [5]. Daptomycin has been approved for the treatment of complicated skin infections and soft tissue infections, as well as bloodstream infections caused by S. aureus, including right lateral endocarditis [6, 7] and as a primary drug in the treatment of persistent MRSA bacteremia when the MIC for vancomycin is 1 µg/mL, as being more effective than vancomycin for this type of infection [8, 9].
Considering that in the in vivo scenario bacteria are not being exposed to constant but constantly changing antibiotic concentrations, pharmacokinetic/pharmacodynamic (PK/PD) models based on time-kill curves can be used to assess the anti-infective efficacy of antibiotics. Time-kill curves that monitor bacterial growth and death over a wide range of antimicrobial concentrations have been frequently used to evaluate the effect of antimicrobials over time. These data can be analyzed using mathematical models and are often the first step in PK/PD modeling [10]. The advantage of these in vitro models is that they provide for a much more detailed assessment of the pharmacokinetic-pharmacodynamic relationship than the simple use of MICs and allow direct comparison of the effects of various concentration profiles. More detailed information about the time course of antibacterial effect can be assessed by employing time-kill curves. While experimental kill curves enable a dynamic interpretation of drug-bacteria interactions, the strength of this approach is not fully exploited until the data are analyzed by means of mathematical models [11].
In order to understand the dose-efficacy binomial of the drug, pharmacokinetic and pharmacodynamic relationships need to be established. The PK/PD indexes for antibiotics represent these relationships and are already defined in the literature. Daptomycin presents as a PK/PD index most predictive of efficacy fAUC/MIC, being considered a concentration-dependent drug [12]. Safdar et al. (2004) employed the neutropenic murine thigh model to characterize the pharmacodynamics of daptomycin. The PK and PD parameters that best correlated with in vivo efficacy were AUC/MIC (> R2) [13]. Animal studies have indicated that the fAUC/MIC is the main pharmacodynamics index for S. aureus [14].
The combination of PK/PD targets, pharmacokinetics, and MIC values allows the assessment of established dose regimes and predictions for groups of patients with altered pharmacokinetics, using Monte Carlo simulations [15, 16], for example. In this approach, inter-individual variability in pharmacokinetic and pharmacodynamic parameters is considered and the probability of reaching the target (PTA) is determined using stochastic simulations of the model [17]. The targets to be reached for daptomycin microbiological success have great variability in the literature: some consider only the free fraction; others consider the total concentration of daptomycin in its relationship with MIC [13, 18–20]. Unbound concentrations should preferably be considered for the assessment of daptomycin PK [18]. This lack of consensus on the target to be reached can result in therapeutic failure.
The purpose of this article was (i) to investigate the pharmacodynamic effect of daptomycin against MRSA and MRSE by evaluating the bacterial death curves as a function of time (time-kill curves), (ii) to model the effect of daptomycin as a function of time, (iii) to use Monte Carlo simulations to predict the reduction in the number of CFU/mL with different doses of daptomycin and variations in creatinine clearance, and (iv) to predict the probability of target attainment against MRSA and MRSE.
Methods
Antibiotic, growth media, and microorganism
Daptomycin powder was acquired from Sigma-Aldrich and stored at – 20 °C until analysis. Stock solutions were freshly prepared daily and diluted with Mueller–Hinton broth (Difco Laboratories, Detroit, MI, USA) supplemented with 50 mg of calcium/L (Ca-MHB). Methicillin-resistant Staphylococcus aureus (MRSA) ATCC 33,591 and methicillin-resistant Staphylococcus epidermidis (MRSE) ATCC 29,887 were provided by Instituto Oswaldo Cruz/Fiocruz, Rio de Janeiro, Brazil. The microorganisms were kept at – 70 °C in skim milk. The inocula for minimum inhibitory concentration (MIC) and time-kill curve experiments were prepared in NaCl 0.9% solution and adjusted with Ca-MHB to a final concentration of approximately 5 × 10⁵ CFU/mL.
Determination of minimum inhibitory concentration (MIC)
The MIC of daptomycin for MRSA ATCC 33,591 and MRSE ATCC 29,887 was determined in duplicate according to the Clinical and Laboratory Standards Institute (CLSI) guidelines [21]. The broth in the microdilution wells was read by visual inspection after incubation for approximately 21 h at 35 °C.
Constant concentration time-kill curves
The model consisted of a 50-mL culture flask containing 30 mL Ca-MHB. The flasks were incubated at 35 °C with constant shaking. An aliquot of a suspension of the initial inoculation (1 × 10⁸ CFU/mL) was added to the in vitro model to produce approximately 5 × 10⁵ CFU/mL. Different daptomycin concentrations were added after bacteria incubation for 1 h. Multiples of MIC (0.25 ×, 0.5 ×, 1 ×, 3 ×, 5 ×, and 10 × MIC) were assessed. A negative control experiment with bacteria and without drug was running simultaneously. Samples were taken from a period of 48 h. All experiments were conducted in duplicate. Bacterial counts were determined on all countable plates (upper limit: 200 CFU) by plating 20 μL of tenfold diluted aliquots on tryptic soy agar plates. The number of CFU/mL was determined after an incubation period of approximately 21 h.
PK/PD modeling
The time-kill curve analysis and mathematical modeling of the kill curve data were fitted to an Emax model employing a non-linear regression software program, Scientist® 3.0 (Micromath, Salt Lake City, UT, USA), according to the Eq. 1:
| 1 |
where dN/dt is the range in number of bacteria as a function of time; k0 is the bacterial growth rate constant in the absence of daptomycin; N (CFU/mL) is the number of viable bacteria; Nmax (CFU/mL) is the maximum number of bacterium; kmax is the maximum killing rate constant (maximum effect); C (µg/mL) is the concentration of daptomycin at any time (t); EC50 (µg/mL) is the concentration of daptomycin necessary to produce 50% maximum effect; h is the Hill coefficient factor; x is the delay in the onset of growth; and z is the delay in the microbial death.
For the control experiment, bacterial growth was fitted using the following Eq. 2:
| 2 |
To determine the model for each strain, the graphic profiles were visually inspected for the best fit, as well as the model selection criterion (MSC), in addition to the determination coefficient (r2) and the correlation between the calculated values and those observed experimentally. No weight was applied to the data when performing the PK/PD modeling. The parameters determined by the PK/PD modeling were compared statistically (alpha = 0.05).
Monte Carlo simulations
For Monte Carlo simulations, the pharmacodynamic parameters determined in vitro experiments and the population pharmacokinetic data for daptomycin described in the literature by DiPaolo et al. were used [22]. This model was chosen because it was the population model that most closely matched the objective of the study, which included simulating the variations in creatinine clearance with the clinical outcome, in addition to containing the covariables that were physiologically important for the pharmacokinetics of daptomycin.
Monte Carlo simulations (1000 subjects) were performed using Berkeley Madonna v 8.3.18. Different scenarios were evaluated including Monte Carlo simulations using MIC of 0.06, 0.12, 0.25, 0.5, 1, 2, 4, and 8 µg/mL and various dosing regimens of daptomycin (6, 8, and 10 mg/kg/day).
The one-compartment population pharmacokinetic model (Eq. 3) was used with a 30-min infusion and linear elimination with a covariate model (Eq. 4) and the 90% plasma protein binding was assumed [22, 23].
| 3 |
where A1 is the amount of drug in the compartment; t is the time; inf_rate is the infusion rate in mg/h; inf_time is the infusion time in h; CLi is the individual clearance of daptomycin; and Vd is the volume of distribution.
| 4 |
where CLi is the individual clearance of daptomycin; CLpop is the population clearance estimated by the population model of the study by DiPaolo et al. [22]; β is the exponential factor of the continuous covariate; CLCR is the creatinine clearance of individual creatinine; and CLCR_m is the average creatinine clearance. The following parameters of daptomycin were used: clearance = 0.8016 L/h (RSE% 4.71), volume of distribution = 12.29 L (RSE% 5.41), individual creatinine clearance = 0.2026 (RSE% 35.46), and inter-individual variability in daptomycin clearance = 20.74 (RSE% 43.69).
To simulate the different creatinine clearance, the following data were used:
CLCR 15–29 mL/min/1.73 m2
Mean_CLCr= 22.5
init CLCr_var = normal(0, 1)*1.35
CLCR 30–49 mL/min/1.73 m2
Mean_CLCr= 39.5
init CLCr_var = normal(0, 1)*3.75
CLCR 50–100 mL/min/1.73 m2
Mean_CLCr= 75
init CLCr_var = normal(0, 1)*9.37
The PK/PD parameters obtained in the pharmacodynamics model were used in the simulations to generate the CFU/mL reduction profiles versus daptomycin time with variations in creatinine clearance (CLCR) of 15–29 mL/min/1.73 m2, 30–49 mL/min/1.73 m2, and 50–100 mL/min/1.73 m2. To estimate the impact of doses of 6, 8, and 10 mg/kg/ day on the reduction of CFU/mL, the parameters obtained by PK/PD modeling were used in Monte Carlo simulations. Considering that clinically with CLCR below 30 mL/min/1.73 m2 the interval between doses should be increased in order not to impair the therapy, a simulation was also carried out with an interval of 48 h for the three doses of daptomycin. Logarithmic reductions were determined by subtracting the CFU/mL values from the initial inoculum from those predicted for 18 days of treatment with daptomycin. Likewise, the probability of reaching the target of fAUC/MIC of 80 [18] was calculated against the wide range of MIC, both for MRSA and MRSE.
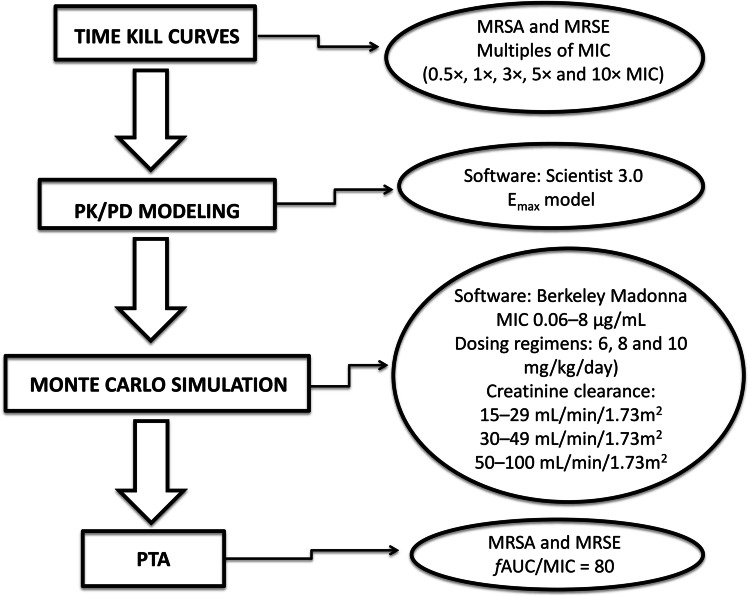
The methodology workflow related to experiments can be seen in Fig. 1.
Fig. 1.
Methodology workflow related to experiments
Results
Determination of the minimum inhibitory concentration
For MRSA ATCC 33,591 and MRSE ATCC 29,887, the daptomycin MIC in Ca-MHB was 0.5 µg/mL. This MIC value was in agreement with the European Committee on Antimicrobial Susceptibility Testing (EUCAST) [24].
PK/PD modeling
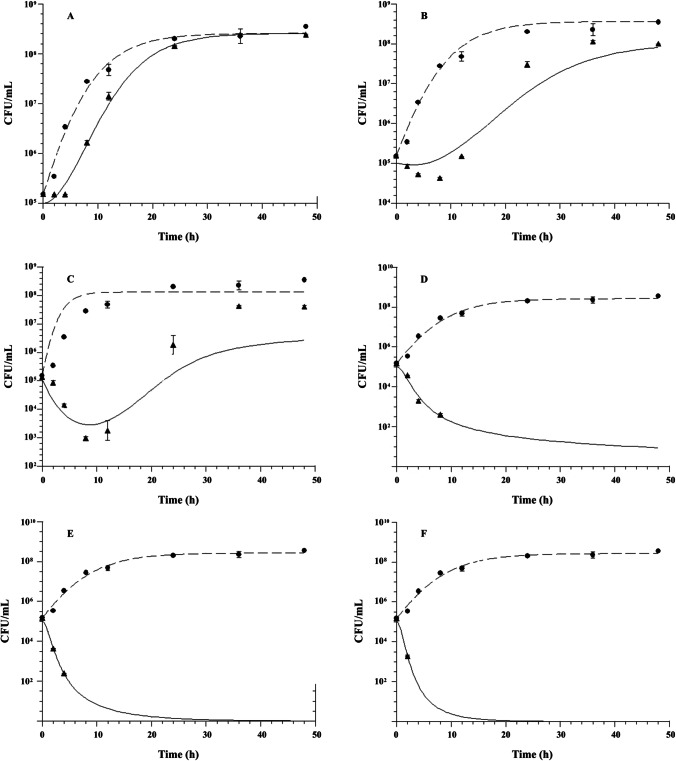
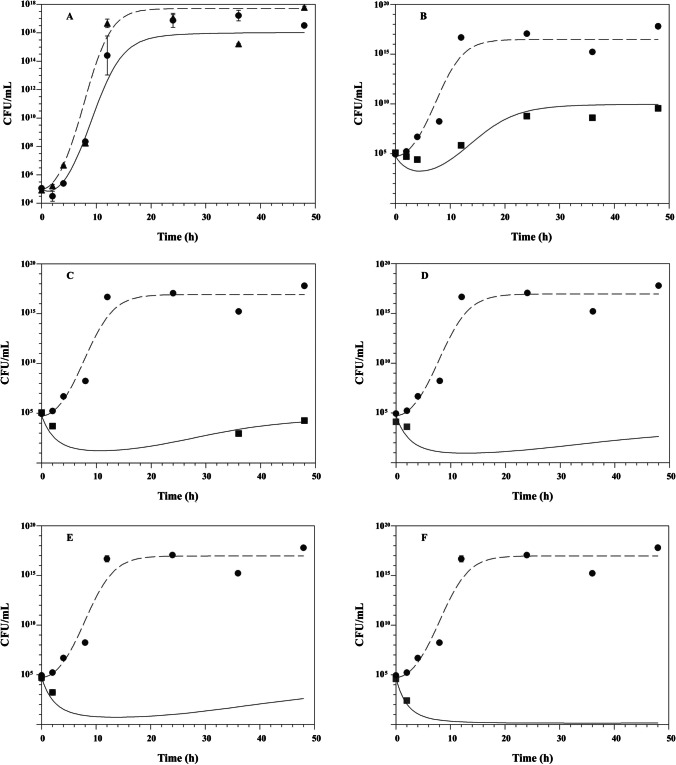
The fitted time-kill curves of daptomycin evaluated by the modified Emax model are shown in Fig. 2 and Fig. 3. This model was able to adequately describe the inhibition of microbial growth as a function of time for both microorganisms evaluated, against the largest multiples of MIC. The PK/PD modeling showed model selection criteria (MSC) values greater than 2.5 when constant concentrations (multiples of MIC) of daptomycin were simulated in the experimental in vitro infection model. The calculated PK/PD parameters of daptomycin are shown in Table 1. The analysis of the PK/PD parameters showed that the microbial growth kinetics of MRSE was higher than that of MRSA, with microbial generation constant values of 0.443 ± 0.029 h−1 and 0.218 ± 0.136 h−1, respectively (p = 0.014). In the in vitro system (without daptomycin), the maximum number of colonies (Nmax) capable of growing was higher for MRSE compared to the MRSA strain, with values of 17.071 ± 0.166 CFU/mL and 8.425 ± 0.154 CFU/mL, respectively (p < 0.001). When evaluating the EC50 parameter, it was demonstrated that daptomycin did not show a statistically significant difference in potency in relation to both evaluated microorganisms (p = 0.453), with the MRSA presenting an EC50 of 0.434 ± 0.215 µg/mL and the MRSE of 0.50 ± 0.247 µg/mL. In comparing the maximum effect of microbial death (kmax), it was demonstrated that daptomycin exerts a similar effect of death in relation to both strains evaluated (p = 0.111).
Fig. 2.
Effect of daptomycin on methicillin-resistant Staphylococcus aureus ATCC 33,591 growth at multiples of minimum inhibitory concentration (MIC) (μg/mL): (A) 0.25 × MIC; (B) 0.5 × MIC; (C) 1 × MIC; (D) 3 × MIC; (E) 5 × MIC; and (F) 10 × MIC. Control without drug; black up-pointing triangle, with daptomycin, n = 2 experiments/group. Mean values are plotted with error bars indicating standard deviations
Fig. 3.
Effect of daptomycin on methicillin-resistant Staphylococcus epidermidis ATCC 29,887 growth at various multiples of minimum inhibitory concentration (MIC) (μg/mL): (A) 0.25 × MIC; (B) 0.5 × MIC; (C) 1 × MIC; (D) 3 × MIC; (E) 5 × MIC; and (F) 10 × MIC. Control without drug; black up-pointing triangle, with daptomycin, n = 2 experiments/group. Mean values are plotted with error bars indicating standard deviations
Table 1.
PK/PD parameters of daptomycin against S. aureus ATCC 33,591 and S. epidermidis ATCC 29,887 at different multiples of the minimum inhibitory concentration (0.5 μg/mL)
| Multiples MIC | 0.25 × MIC | 0.5 × MIC | 1 × MIC | 3 × MIC | 5 × MIC | 10 × MIC | ||
|---|---|---|---|---|---|---|---|---|
| Parameters | Average | SD | ||||||
| Staphylococcus aureus ATCC 33,591 | ||||||||
| k0 (h−1) | 0.115 | 0.191 | 0.493 | 0.175 | 0.169 | 0.168 | 0.218 | 0.136 |
| Nmax (CFU/mL) | 8.605 | 8.521 | 8.147 | 8.407 | 8.436 | 8.437 | 8.425 | 0.154 |
| kmax (h−1) | 0.015 | 0.033 | 0.200 | 0.356 | 0.564 | 0.705 | 0.312 | 0.282 |
| EC50 (μg/mL) | 0.544 | 0.602 | 0.647 | 0.482 | 0.184 | 0.149 | 0.434 | 0.215 |
| h (h−1) | 0.120 | 0.107 | 0.234 | 0.068 | 0.014 | 0.007 | ⁄ | ⁄ |
| x (h−1) | 0.029 | 0.061 | 0.046 | 0.482 | 0.211 | 0.167 | ⁄ | ⁄ |
| z (h−1) | 1.810 | 1.296 | 1.877 | 1.044 | 1.040 | 1.228 | ⁄ | ⁄ |
| Staphylococcus epidermidis ATCC 29,887 | ||||||||
| k0 (h−1) | 0.452 | 0.443 | 0.394 | 0.487 | 0.438 | 0.445 | 0.443 | 0.029 |
| Nmax (CFU/mL) | 17.412 | 16.958 | 17.008 | 17.005 | 17.029 | 17.015 | 17.071 | 0.168 |
| kmax (h−1) | 0.121 | 0.496 | 0.531 | 0.712 | 0.701 | 0.622 | 0.530 | 0.218 |
| EC50 (μg/mL) | 0.343 | 0.766 | 0.871 | 0.405 | 0.314 | 0.326 | 0.504 | 0.247 |
| h (h−1) | 0.480 | 0.368 | 0.362 | 0.169 | 0.255 | 0.374 | ⁄ | ⁄ |
| x (h−1) | 0.106 | 0.130 | 0.153 | 0.114 | 0.130 | 0.129 | ⁄ | ⁄ |
| z (h−1) | 0.056 | 0.283 | 0.430 | 0.436 | 0.467 | 0.325 | ⁄ | ⁄ |
Monte Carlo simulations
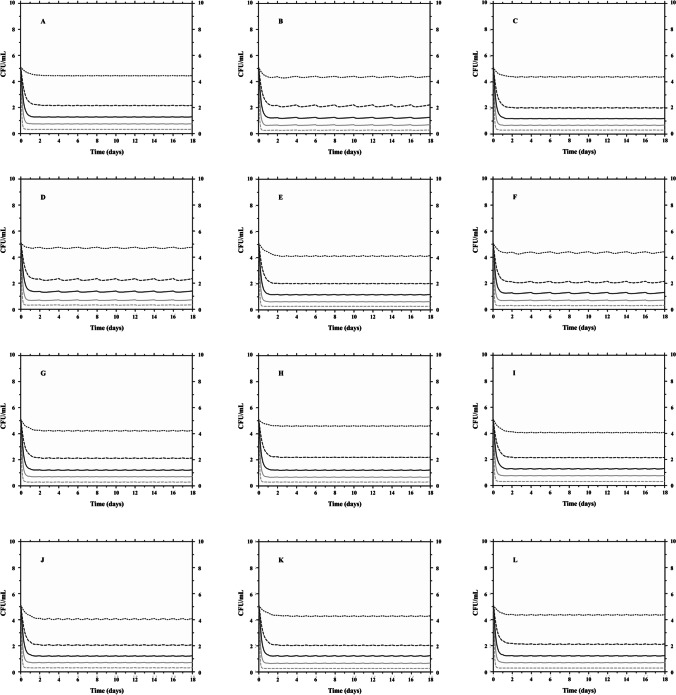
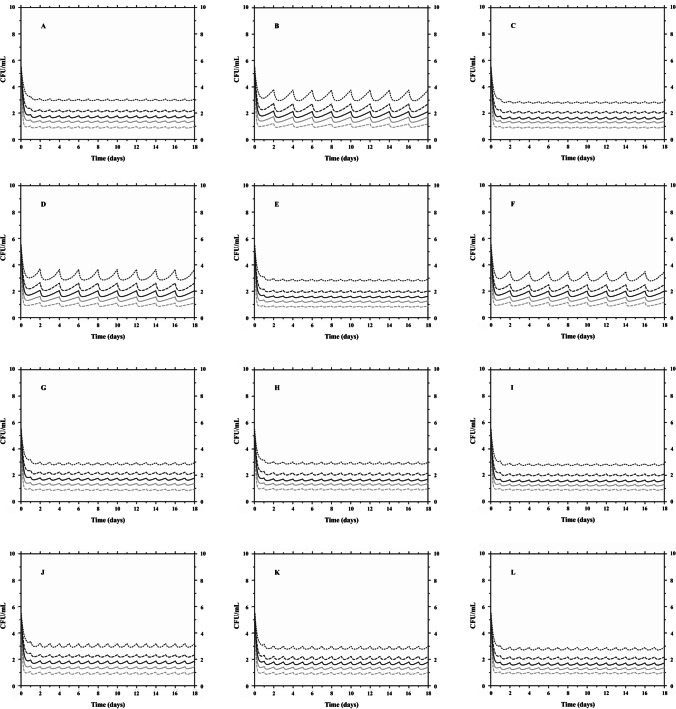
Twelve clinical scenarios were simulated for each microorganism (MRSA and MRSE), associating three ranges of values for the covariate creatinine clearance (CLCR): CLCR 15–29 mL/min/1.73 m2, CLCR 30–49 mL/min/1.73 m2, and CLCR 50–100 mL/min/1.73 m2. For each clinical scenario, 1000 subjects were simulated receiving daptomycin doses of 6, 8, and 10 mg kg/day, as well as these same doses every 48 h in the lower clearance range. The predicted scenarios with variation in the number of CFU/mL for 18 days of treatment with daptomycin against MRSA and MRSE strains can be seen in Fig. 4 and Fig. 5, respectively.
Fig. 4.
PK/PD Monte Carlo simulations of clinical methicillin-resistant Staphylococcus aureus ATCC 33,591 responses to daptomycin with creatinine clearance as covariate (–-) CFU 5th percentile; (-) CFU 25th percentile; (-) CFU median; (–-) CFU 75th percentile; (-) CFU 95th percentile. A, B, and C CLCR 15–29 mL/min/1.73 m2 for 6, 8, and 10 mg/kg/day, respectively; D, E, and F CLCR 15–29 mL/min/1.73 m2 for 6, 8, and 10 mg/kg/48 h, respectively; G, H, and I CLCR 30–49 mL/min/1.73 m2 for 6, 8, and 10 mg/kg/day; and J, K, and L CLCR 50–100 mL/min/1.73 m2 for 6, 8, and 10 mg/kg/day
Fig. 5.
PK/PD Monte Carlo simulations of clinical methicillin-resistant Staphylococcus epidermidis ATCC 29,887 responses to daptomycin with creatinine clearance as covariate (–-) CFU 5th percentile; (-) CFU 25th percentile; (-) CFU median; (–-) CFU 75th percentile; (-) CFU 95th percentile. A, B, and C CLCR 15–29 mL/min/1.73 m2 for 6, 8, and 10 mg/kg/day, respectively; D, E, and F CLCR 15–29 mL/min/1.73 m2 for 6, 8, and 10 mg/kg/48 h, respectively; G, H, and I CLCR 30–49 mL/min/1.73 m2 for 6, 8, and 10 mg/kg/day; and J, K, and L CLCR 50–100 mL/min/1.73 m2 for 6, 8, and 10 mg/kg/day
In Fig. 4, Monte Carlo simulations showed that the lowest simulated dose of 6 mg/kg was enough to reduce > 2 log CFU/mL (99%) of MRSA after 18 days of treatment for 75th percentile of the simulated population, reaching a reduction close to 3 log CFU/mL, regardless of the CLCR range and/or administration interval (24 h versus 48 h). In contrast, when analyzing the MRSE (Fig. 5), it was observed that the dose of 6 mg/kg/day is sufficient to reduce > 3 log CFU/mL (99.9%), regardless of the CLCR considered, after 18 days, for 95% of the population. However, when adjusting the dose interval (every 48 h) for the lowest CLCR range (15–29 mL/min/1.73 m2), 75th percentile of the simulated population reaches a microbiological reduction of 2 log CFU/mL with MIC of 0.5 µg/mL.
In the present study, we used MIC simulation to analyze the capacity of various regimes. Anti-MRSA and anti-MRSE hit the PK/PD target associated with their effectiveness. Daptomycin in dosage regimes ≥ 6 mg/kg/day reaches the target > 90% for MRSA and MRSE with MIC = 0.5 when simulating patients with CLCR of 15–49 mL/min/1.73 m2. With CLCR 50–100 mL/min/1.73 m2, the target is reached with doses ≥ 8 mg/kg/day (Fig. 6 and Fig. 7).
Fig. 6.
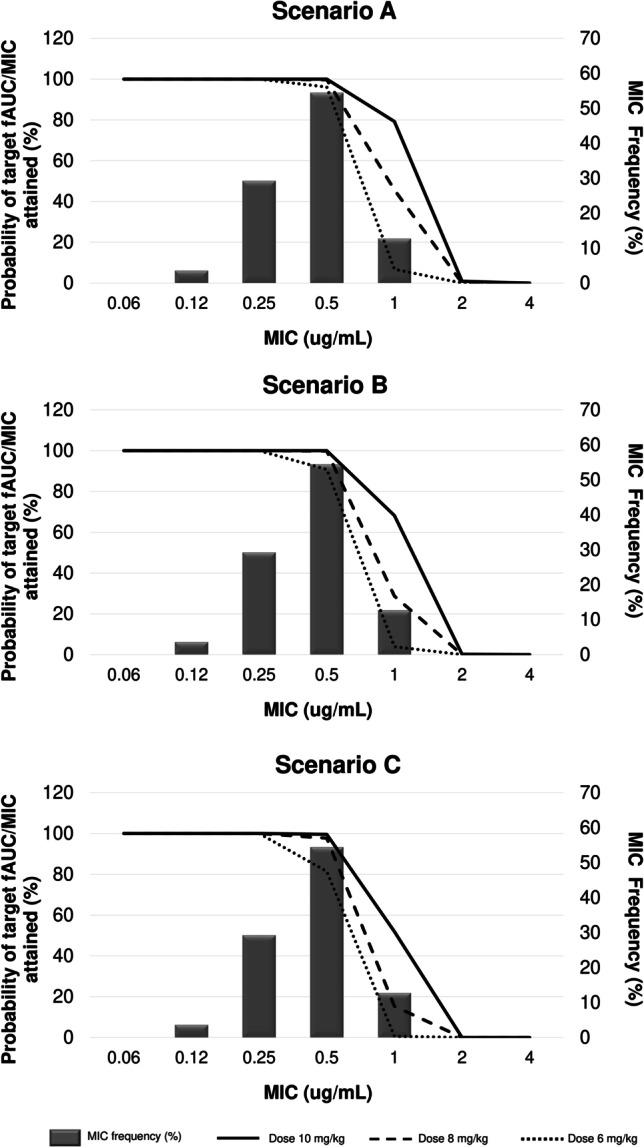
Distribution of the simulated PTA of fAUC/MIC > 80 achievable with different daptomycin dosing regiments in various clinical scenarios of bacteremia for methicillin-resistant Staphylococcus aureus ATCC 33,591. Scenario A, B, and C CLCR 15–29 mL/min/1.73 m2, CLCR 30–49 mL/min/1.73 m2, and CLCR 50–100 mL/min/1.73 m2 in MRSA bloodstream infections. Doses are given as mg/kg in the legends. MIC frequency is shown as a bar graph (EUCAST, 2021). Probability of target fAUC/MIC attained is shown as a line plot
Fig. 7.
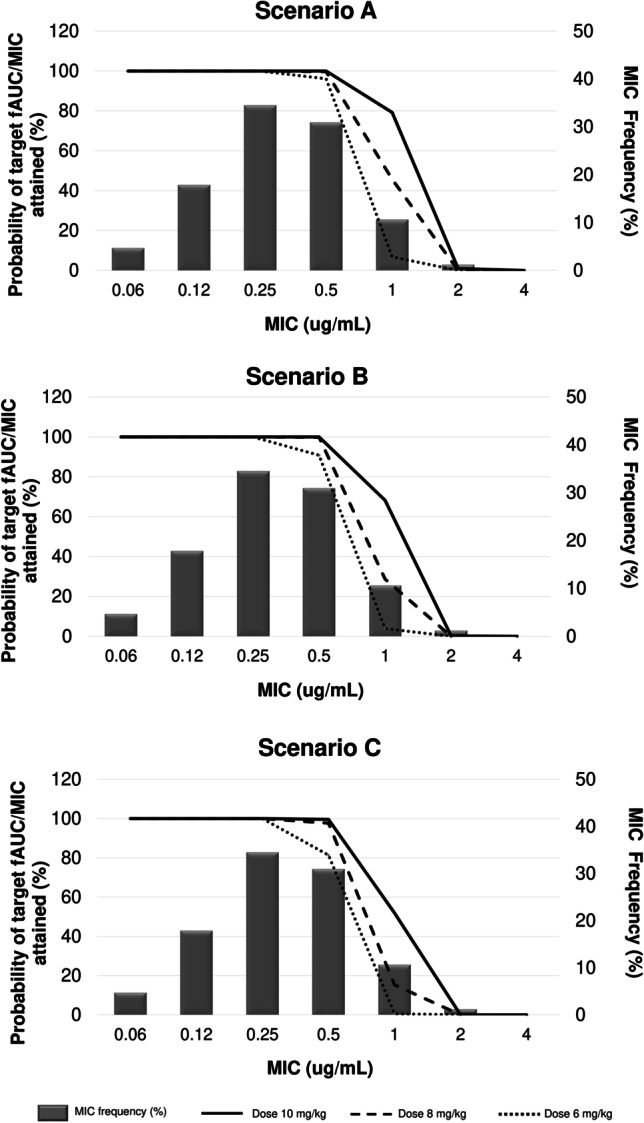
Distribution of the simulated PTA of fAUC/MIC > 80 achievable with different daptomycin dosing regiments in various clinical scenarios of bacteremia for methicillin-resistant Staphylococcus epidermidis ATCC 29,887. Scenario A, B, and C CLCR 15–29 mL/min/1.73 m2, CLCR 30–49 mL/min/1.73 m2, and CLCR 50–100 mL/min/1.73 m2 in MRSE bloodstream infections. Doses are given as mg/kg in the legends. MIC frequency is shown as a bar graph (EUCAST, 2021). Probability of target fAUC/MIC attained is shown as a line plot
Discussion
The treatment of antibiotic-resistant Gram-positive bacteria remains a major challenge, despite the development of new drugs. Vancomycin has long been the gold standard for the treatment of these microorganisms, but clinical and microbiological failures have been described in MRSA isolates with a high minimum inhibitory concentration (1–2 µg/mL) for vancomycin, even when reported as susceptible. Daptomycin is a novel lipopeptide antibiotic with potent in vitro bactericidal activity against most clinically relevant strains of Gram-positive bacteria [25]. Most clinical isolates of MRSE and other coagulase-negative (CoNS) resistant to methicillin are susceptible to daptomycin at a MIC of 0.5 µg/mL or less [26].
Daptomycin demonstrates excellent effectiveness in the treatment of MRSA and MRSE bacteremia. Fowler et al. (2006) demonstrated non-inferiority in MRSA bacteremia and endocarditis at a dose of 6 mg/kg/day when comparing to standard therapy. Kullar et al. (2013), in their quasi-experimental study, demonstrated that early treatment with daptomycin for MRSA bacteremia in strains with vancomycin MIC ≥ 1 µg/mL demonstrated better rates of clinical success for daptomycin compared to vancomycin (75.0% versus 41.4%; p < 0.001) [27]. The same success is seen in bacteremia and MRSE endocarditis [28].
In this study, microbial death curves (time-kill curves) are used, as well as Monte Carlo simulations. Considering that the use of MIC does not reflect a detailed characterization of antimicrobial activity, being a monodimensional value, and neglecting dynamic changes in the growth and susceptibility of the microorganism [29], time-kill curves were used. In this approach, data could be modeled and the effect parameters such as kmax, k0, and EC50 compared between different microorganisms against daptomycin. The choice of the PK/PD model that best described the experimental data can be verified by the help of visual graph, model selection criteria (MSC), and data correlation coefficient. The model considered a predicted delay factor in bacterial growth and delay in the death profile, for both MRSA and MRSE. Comparatively, there was no statistically significant difference in the EC50 parameter, demonstrating that daptomycin has the same potency compared to both strains evaluated in the PK/PD model.
For drugs eliminated by the kidneys, CLCR is often considered an important variable among patients and can guide dose individualization [29]. Since the pharmacokinetics of antibiotics may be altered in critically ill patients and knowing that CLCR is an important covariate in the population pharmacokinetic model for daptomycin, we proceeded to simulate both the reduction of CFU/mL and the probability of reaching the target (PTA%) with variations in the CLCR, since this covariate can modify the concentrations of daptomycin depending on the time to which the bacteria will be exposed. Thus, we employ a population pharmacokinetic model considering the binding of daptomycin to 90% plasma proteins and apply it in the PK/PD analysis to perform Monte Carlo simulations, allowing simulating different scenarios to predict the clinical outcome.
Several studies have shown that the PK/PD AUC/MIC index is the one that best determines the in vivo activity of daptomycin [13, 20] against staphylococci. Although the PK/PD indexes are simplifications of the PK/PD ratios, none of them results in perfect graphical adjustments since different dosing regimens can result in the same index value [29]. Salem et al. 2014 [30] used Monte Carlo simulation as an approach to assess daptomycin doses of 4 mg/kg/day and 6 mg/kg/day against MRSA. The authors observed that the PK/PD susceptibility breakpoint value was 0.12 µg/mL, about 8 times less than the value recommended by EUCAST, which uses the conventional approach. In this analysis, the PTA at the dose of 6 mg/kg/day was < 10% for daptomycin MIC of 0.5 µg/mL. In our study, for this MIC value compared to MRSA and MRSE in individuals with loss of renal function (CLCR 15–49 mL/min/1.73 m2), the probability of reaching the fAUC/MIC = 80 target was greater than 90%, using doses from 8 to 10 mg/kg/day. Patients with kidney failure benefit from treatment with daptomycin since the drug’s clearance is decreased. Studies demonstrate that there is no kidney damage related to the drug [31].
A similar study was carried out by Cojutti et al. 2017 [32] using Monte Carlo simulations for daptomycin doses of 6 to 12 mg/kg/day and target of AUC/MIC > 1081. The authors simulated different clearance ranges (50–100 mL/min/1.73 m2 and 101–150 mL/min/1.73 m2), albumin concentrations (15–25 g/L and 25–45 g/L), and patients with and without hematological problems. The authors concluded that doses of daptomycin ≥ 8 mg/kg/day should be considered in clinical settings for patients with hematological problems. However, for patients with hematological problems with high clearance and severe hypoalbuminemia, the dose of daptomycin of 12 mg/kg/day does not seem to be sufficient for microbial eradication. Bhavnani et al. 2010 [33] also used AUC/MIC > 1081 based on data from patients with uncomplicated bacteremia caused by Staphylococcus aureus with daptomycin at 6 mg/kg/day. This target was associated with a probability of clinical cure > 80% in patients with normal renal function, with normal or hypoalbuminemia.
In an analysis of the study by Grégoire et al. 2019 [18], patients with skin and soft tissue infections, bacteremia, or endocarditis in the ICU sector with various creatinine parameters and the use of daptomycin were evaluated. In this study, the simulated targets were fAUC/MIC > 40 or in cases of renal toxicity fAUC/MIC > 80 with good results.
For MRSE, no similar study has yet been found in the literature for comparison. Different published works present varying values as targets of PK/PD indexes for daptomycin, which makes it difficult to compare results. The lack of consensus on these targets allows only particularized interpretations.
When comparing the microbial population in the analysis of the percentiles (Fig. 4 and Fig. 5), we observed that there is an important reduction in the number of CFU/mL for both MRSA and MRSE in the first 24 h of simulated profile. Since daptomycin is excreted through the kidneys, the dosage interval is increased to 48 h in patients with severe renal impairment (CLCR < 30 mL/min). Thus, when the simulation was performed with these doses at 48-h intervals, the fluctuation was greater than when the doses were simulated every 24 h, with a smaller reduction in the number of CFU/mL for MRSE strains and similar performance to simulation for MRSA strains.
The ideal therapeutic dose for treating severe infections using daptomycin is not yet defined. Several national and international treatment guidelines include high doses of daptomycin (8 to 10 mg/kg/day) as a therapeutic option for complicated infections [34, 35]. Relating ideal dose and renal function, Moise et al. [31] comment in their manuscript that a reduction in the effectiveness of daptomycin was observed in patients with moderate renal failure (OR 9.11; 95% CI, 1.46–56.8), due to the use of smaller doses and/or intervals between doses. Our study with daptomycin suggests that this drug can be used in cases of MRSA bacteremia at doses of 6 to 10 mg/kg/day, including at intervals of 48 h with creatinine clearance of 15–29 mL/min/1.73 m2. In MRSE bacteremia, we found the same doses of 6 to 10 mg/kg/day, in all simulated ranges with 95% microbiological eradication without the need to adjust the dose for clearance between 15 and 29 mL/min/1.73 m2. However, when considering the PTA approach, microbiological eradication can be achieved in the clearance range of 15–49 mL/min/1.73 m2 and doses ≥ 6 mg/kg/day, which does not occur when the patient has preserved renal function (≥ 50 mL/min/1.73 m2). Thus, patients with impaired renal function could benefit from lower doses such as 6 mg/kg/day. Patients with normal renal function could require a higher dose, such as 10 mg/kg/day, in order to guarantee the effectiveness of bacteremia treatment for both MRSA and MRSE. Based on concentration-dependent activity, higher doses of the drug can lead to faster bacterial eradication and reduce the emergence of resistance. As mentioned in other studies, in infections where it is difficult to achieve adequate local concentration, or in patients with sepsis and high volumes of distribution, higher doses of daptomycin may also be advantageous [34].
Our study with daptomycin suggests that this drug can be used in cases of MRSA bacteremia at doses of 6 to 10 mg/kg/day, including at intervals of 48 h with creatinine clearance of 15–29 mL/min/1.73 m2. In MRSE bacteremia, we found the same doses of 6 to 10 mg/kg/day, in all simulated ranges with 95% microbiological eradication without the need to adjust the dose for clearance between 15 and 29 mL/min/1.73 m2. However, when considering the PTA approach, microbiological eradication can be achieved in the clearance range of 15–49 mL/min/1.73 m2 and doses ≥ 6 mg/kg/day, which does not occur when the patient has preserved renal function (≥ 50 mL/min/1.73 m2). No target was found for the PK/PD index against MRSE. We use the same target as for MRSA, but we are not sure that this index is the one that best relates to the effectiveness of daptomycin against MRSE. In this way, the PTA result for MRSE obtained in this work needs to be interpreted with restriction, showing its limitation.
This article integrates innovative strategies to assess the effect profile of daptomycin against microbial species of medical interest. To make this assessment feasible, instead of performing an empirical comparative analysis between the microbial death profiles observed as a function of time for the effect of daptomycin against the investigated microorganisms, mathematical models were applied, allowing characterizing the in vitro microbial growth curves and the death curves, and the establishment of parameters such as k, EC50, and kmax. This strategy has been used by several authors in the literature [10, 29, 36]. The application of Monte Carlo simulations, in turn, is another strategy, applied to make decisions about the best therapeutic regimens for pharmacological treatments (in this case, the antimicrobial daptomycin). Through these simulations, it is possible to establish the probability of reaching a certain therapeutic target (PTA), which can be a PK/PD index, in a population of virtual patients in which certain components of variability are present (in the case of this paper, the variability was evaluated in terms of creatinine clearance) [37, 38].
Author contribution
All authors were involved in the content development of the manuscript, reviewed all drafts, and approved the final version.
Declarations
Conflict of interest
The authors declare no competing interests.
Footnotes
Publisher's note
Springer Nature remains neutral with regard to jurisdictional claims in published maps and institutional affiliations.
References
- 1.Ayau P, Bardossy AC, Sanchez G, Ortiz R, Moreno D, Hartman P, et al. Risk factors for 30-day mortality in patients with methicillin-resistant Staphylococcus aureus bloodstream infections. Int J Infect Dis. 2017;61:3–6. doi: 10.1016/j.ijid.2017.05.010. [DOI] [PubMed] [Google Scholar]
- 2.Cheung GYC, Otto M. Understanding the significance of Staphylococcus epidermidis bacteremia in babies and children. Curr Opin Infect Dis. 2010;23:208–216. doi: 10.1097/QCO.0b013e328337fecb. [DOI] [PMC free article] [PubMed] [Google Scholar]
- 3.Martínez-Meléndez A, Morfín-Otero R, Villarreal-Treviño L, González-González G, Llaca-Díaz J, Rodrígues-Noriega E, et al. Staphylococcal cassette chromosome mec (SCC mec) in coagulase negative staphylococci. Medicina Universitária. 2015;17:229–233. doi: 10.1016/j.rmu.2015.10.003. [DOI] [Google Scholar]
- 4.Paterson DL. Clinical experience with recently approved antibiotics. Curr Opin Pharmacol. 2006;6:486–490. doi: 10.1016/j.coph.2006.07.001. [DOI] [PubMed] [Google Scholar]
- 5.García-de-la-Mària C, Marco F, Armero Y, Soy D, Moreno A, Del Río A, et al. Daptomycin is effective for treatment of experimental endocarditis due to methicillin-resistant and glycopeptide – intermediate Staphylococcus epidermidis. Antimicrob Agents Chemother. 2010;54:2781–2786. doi: 10.1128/AAC.01011-09. [DOI] [PMC free article] [PubMed] [Google Scholar]
- 6.Arbeit RD, Maki D, Tally FP, Campanaro E, Eisenstein BI. The safety and efficacy of daptomycin for the treatment of complicated skin and skin-structure infections. Clin Infect Dis. 2004;38:1673–1681. doi: 10.1086/420818. [DOI] [PubMed] [Google Scholar]
- 7.Fowler VG, Jr, Boucher HW, Corey GR, Abrutyn E, Karchmer AW, et al. Daptomycin versus standard therapy for bacteremia and endocarditis caused by Staphylococcus aureus. N Engl J Med. 2006;355:653–665. doi: 10.1056/NEJMoa053783. [DOI] [PubMed] [Google Scholar]
- 8.Moore CL, Osaki-Kiyan P, Haque NZ, Perri MB, Donabedian S, Zervos MJ. Daptomycin versus vancomycin for bloodstream infections due to methicillin-resistant Staphylococcus aureus with a high vancomycin minimum inhibitory concentration: a case- control study. Clin Infect Dis. 2012;54:51–58. doi: 10.1093/cid/cir764. [DOI] [PubMed] [Google Scholar]
- 9.Murray KP, Zhao JJ, Davis SL, Kullar R, Kaye KS, Lephart P, et al. Early use of daptomycin versus vancomycin for methicillin resistant Staphylococcus aureus bacteremia with vancomycin MIC 1 mg/L: a matched cohort study. Clin Infect Dis. 2013;56:1562–1569. doi: 10.1093/cid/cit112. [DOI] [PubMed] [Google Scholar]
- 10.Foerster S, Unemo M, Hathaway LJ, Low N, Althaus CL. Time-kill curve analysis and pharmacodynamic modelling for in vitro evaluation of antimicrobials against Neisseria gonorrhoeae. BMC Microbiol. 2016;16:216–227. doi: 10.1186/s12866-016-0838-9. [DOI] [PMC free article] [PubMed] [Google Scholar]
- 11.Mueller M, Peña A, Derendorf H. Issues in pharmacokinetics and pharmacodynamics of anti-infective agents: kill curves versus MIC. Antimicrob Agents Chemother. 2004;48(2):369–377. doi: 10.1128/AAC.48.2.369-377.2004. [DOI] [PMC free article] [PubMed] [Google Scholar]
- 12.Cristinacce A, Wright JG, Macpherson M, Iaconis J, Das S (2021) Comparing probability of target attainment against Staphylococcus aureus for ceftaroline fosamil, vancomycin, daptomycin, linezolid, and ceftriaxone in complicated skin and soft tissue infection using pharmacokinetic/pharmacodynamic models. Diagn Microbiol Infect Dis 99 (4): 115292 [DOI] [PubMed]
- 13.Safdar N, Andes D, Craig WA. In vivo pharmacodynamic activity of daptomycin. Antimicrob Agents Chemother. 2004;48:63–68. doi: 10.1128/AAC.48.1.63-68.2004. [DOI] [PMC free article] [PubMed] [Google Scholar]
- 14.Alder J, Li T, Yu D, Morton L, Silverman J, Zhang XX, et al. Analysis of daptomycin efficacy and breakpoint standards in a murine model of Enterococcus faecalis and Enterococcus faecium renal infection. Antimicrob Agents Chemother. 2003;47:3561–3566. doi: 10.1128/AAC.47.11.3561-3566.2003. [DOI] [PMC free article] [PubMed] [Google Scholar]
- 15.Bradley JS, Dudley MN, Drusano GL. Predicting efficacy of antiinfectives with pharmacodynamics and Monte Carlo simulation. Pediatr Infect Dis J. 2003;22:982–992. doi: 10.1097/01.inf.0000094940.81959.14. [DOI] [PubMed] [Google Scholar]
- 16.Czock D, Markert C, Hartman B, Keller F. Pharmacokinetics and pharmacodynamics of antimicrobial drugs. Expert Opinion Drug Metabob Toxicol. 2009;5:475–487. doi: 10.1517/17425250902913808. [DOI] [PubMed] [Google Scholar]
- 17.Liu Q, Rand K, Derendorf H. Impact of tazobactam pharmacokinetics on the antimicrobial effect of piperacillin-tazobactam combinations. Int J Antimicrob Agents. 2004;23:494–497. doi: 10.1016/j.ijantimicag.2003.10.012. [DOI] [PubMed] [Google Scholar]
- 18.Grégoire N, Marchand S, Ferrandière M, Lasocki S, Seguin P, et al. Population pharmacokinetics of daptomycin in critically ill patients with various degrees of renal impairment. J Antimicrob Chemother. 2019;74:117–125. doi: 10.1093/jac/dky374. [DOI] [PubMed] [Google Scholar]
- 19.EUCAST Steering Committee EUCAST technical note on daptomycin. Clin Microbiol Infect. 2006;12:599–601. doi: 10.1111/j.1469-0691.2006.01455.x. [DOI] [PubMed] [Google Scholar]
- 20.Louie A, Kaw P, Liu W, Jumbe N, Miller MH, Drusano GL. Pharmacodynamics of daptomycin in a murine thigh model of Staphylococcus aureus infection. Antimicrob Agents Chemother. 2001;45:845–851. doi: 10.1128/AAC.45.3.845-851.2001. [DOI] [PMC free article] [PubMed] [Google Scholar]
- 21.Clinical and Laboratory Standards Institute (2014) Performance standards for antimicrobial susceptibility testing: twenty fourth informational supplement, vol. M100- S24. CLSI, Wayne, PA.
- 22.Di Paolo A, Tascini C, Polillo M, Gemignani G, Nielsen EI, Bocci G, et al. Population pharmacokinetics of daptomycin in patients affected by severe Gram-positive infections. Intern J Antimicrob Agents. 2013;42:250–255. doi: 10.1016/j.ijantimicag.2013.06.006. [DOI] [PubMed] [Google Scholar]
- 23.Benvenuto M, Benziger DP, Yankelev S, Vigliani G. Pharmacokinetics and tolerability of daptomycin at doses up to 12 milligrams per kilogram of body weight once daily in healthy volunteers. Antimicrob Agents Chemother. 2006;50:3245–3249. doi: 10.1128/AAC.00247-06. [DOI] [PMC free article] [PubMed] [Google Scholar]
- 24.EUCAST. 2021. Available at: http// www.eucast.org/clinical_breakpoint (last accessed 19 may 2021).
- 25.Wu G, Abraham T, Rapp J, Vastey F, Saad N, Balmir E. Daptomycin: evaluation of a high-dose treatment strategy. Intern J Antimicrob Agents. 2011;38:192–196. doi: 10.1016/j.ijantimicag.2011.03.006. [DOI] [PubMed] [Google Scholar]
- 26.Duah M. Daptomycin for methicillin-resistant Staphylococcus epidermidis native-valve endocarditis: a case report. Ann Clin Microbiol Antimicrob. 2010;9:1–4. doi: 10.1186/1476-0711-9-9. [DOI] [PMC free article] [PubMed] [Google Scholar]
- 27.Kullar R, Davis SL, Kaye KS, Levine DP, Pogue JM, Rybak MJ. Implementation of an antimicrobial stewardship pathway with daptomycin for optimal treatment of methicillin-resistant Staphylococcus aureus bacteremia. Pharmacotherapy. 2013;33:3–10. doi: 10.1002/phar.1220. [DOI] [PubMed] [Google Scholar]
- 28.Gawronski KM. Successful use of daptomycin in a preterm neonate with persistent methicillin-resistant Staphylococcus epidermidis bacteremia. J Pediatr Pharmacol Ther. 2015;20:61–65. doi: 10.5863/1551-6776-20.1.61. [DOI] [PMC free article] [PubMed] [Google Scholar]
- 29.Nielsen EI, Friberg LE. Pharmacokinetic-pharmacodynamic modeling of antibacterial drugs. Pharmacol Rev. 2013;65:1053–1090. doi: 10.1124/pr.111.005769. [DOI] [PubMed] [Google Scholar]
- 30.Salem AH, Zhanel GG, Ibrahim SA, Noreddin AM. Monte Carlo simulation analysis of ceftobiprole, dalbavancin, daptomycin, tigecycline, linezolid and vancomycin pharmacodynamics against intensive care unit-isolated methicillin-resistant Staphylococcus aureus. Clin Exp Pharmacol Physiol. 2014;41:437–443. doi: 10.1111/1440-1681.12195. [DOI] [PubMed] [Google Scholar]
- 31.Moise PA, Amodio-Groton M, Rashid M, Lamp KC, Hoffman-Roberts HL, Yoon MJ, et al. Multicenter evaluation of the clinical outcomes of daptomycin with and without concomitant-lactams in patients with Staphylococcus aureus bacteremia and mild to moderate renal impairment. Antimicrob Agents Chemother. 2013;57:1192–1200. doi: 10.1128/AAC.02192-12. [DOI] [PMC free article] [PubMed] [Google Scholar]
- 32.Cojutti PG, Candoni A, Ramos-Martin V, Lazzarotto D, Zannier ME, Fanin R, et al. Population pharmacokinetics and dosing considerations for the use of daptomycin in adult patients with haematological malignancies. J Antimicrob Chemother. 2017;72:2342–2350. doi: 10.1093/jac/dkx140. [DOI] [PubMed] [Google Scholar]
- 33.Bhavnani SM, Ambrose PG, Hammel JP, Rubino CM, Drusano GL. Evaluation of daptomycin exposure and efficacy and safety endpoints to support risk-versus-benefit considerations. Antimicrob Agents Chemother. 2015;60:1600–1607. doi: 10.1128/AAC.02967-15. [DOI] [PMC free article] [PubMed] [Google Scholar]
- 34.Seaton RA, Menichetti F, Dalekos G, Beiras-Fernandez A, Nacinovich F, Pathan R, et al. Evaluation of effectiveness and safety of high-dose daptomycin: results from patients included in the European Cubicin® outcomes registry and experience. Adv Ther. 2015;32:1192–1205. doi: 10.1007/s12325-015-0267-4. [DOI] [PMC free article] [PubMed] [Google Scholar]
- 35.Yabuno K, Seki M, Miyawaki K, Miwa Y, Tomono K. High-dose, short-interval daptomycin regimen was safe and well tolerated in three patients with chronic renal failure. Clin Pharmacol. 2013;5:161–166. doi: 10.2147/CPAA.S53681. [DOI] [PMC free article] [PubMed] [Google Scholar]
- 36.Budha NR, Lee RB, Hurdle JG, Lee RE, Meibohm B. A simple in vitro PK/PD model system to determine time-kill curves of drugs against Mycobacteria. Tuberculosis (Edinb) 2009;89:378–385. doi: 10.1016/j.tube.2009.08.002. [DOI] [PMC free article] [PubMed] [Google Scholar]
- 37.Asín-Prieto E, Rodríguez-Gascón A, Isla A. Applications of the pharmacokinetic/pharmacodynamic (PK/PD) analysis of antimicrobial agents. J Infect Chemother. 2015;21(5):319–329. doi: 10.1016/j.jiac.2015.02.001. [DOI] [PubMed] [Google Scholar]
- 38.Trang M, Dudley MN, Bhavnani SM. Use of Monte Carlo simulation and considerations for PK–PD targets to support antibacterial dose selection. Curr Opin Pharmacol. 2017;36:107–113. doi: 10.1016/j.coph.2017.09.009. [DOI] [PubMed] [Google Scholar]


