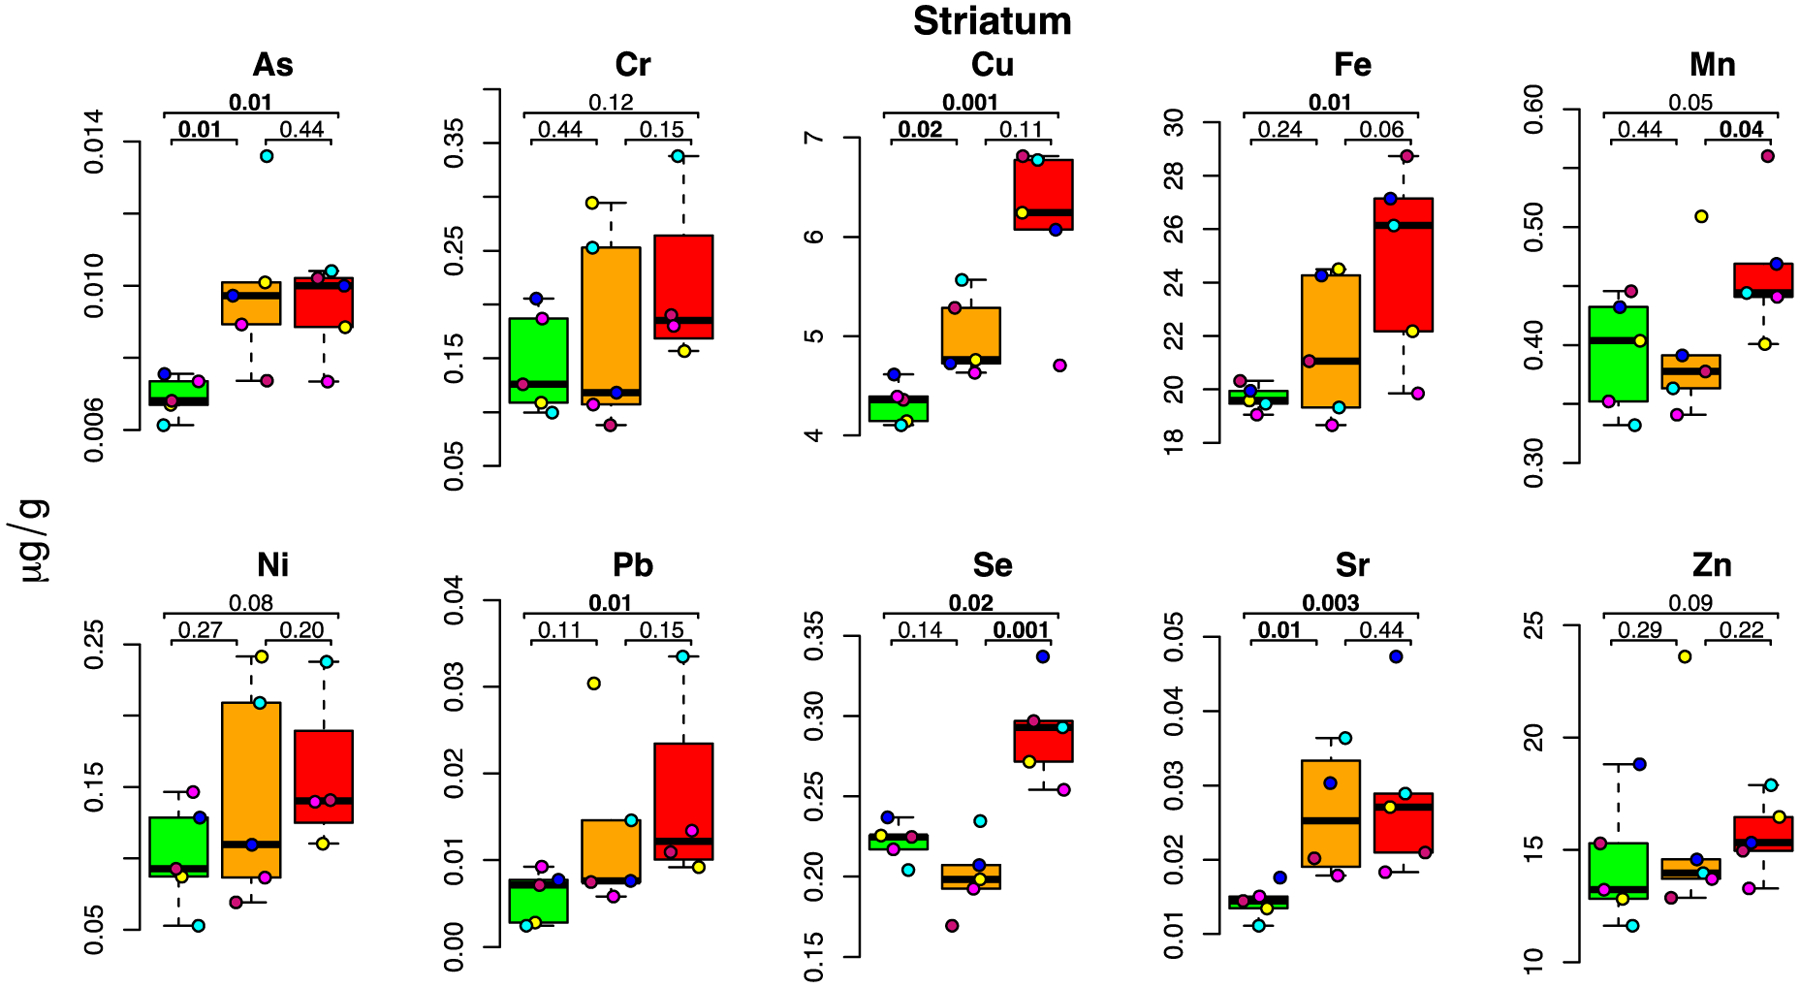
Figure 4: E-cigarette aerosol-mediated metal level changes in the striatum.

For each metal, box plots are shown for metal concentrations measured in the five mice in the control (green), low dose (orange) and high dose (red) exposure groups. Each individual mouse within a group is identified by a different color. The number of samples (after outlier removal) ranges between 4 and 5 for each box plot as indicated by the number of datapoints. Below MDL measurements are indicated by a square, above MDL by a circle.
