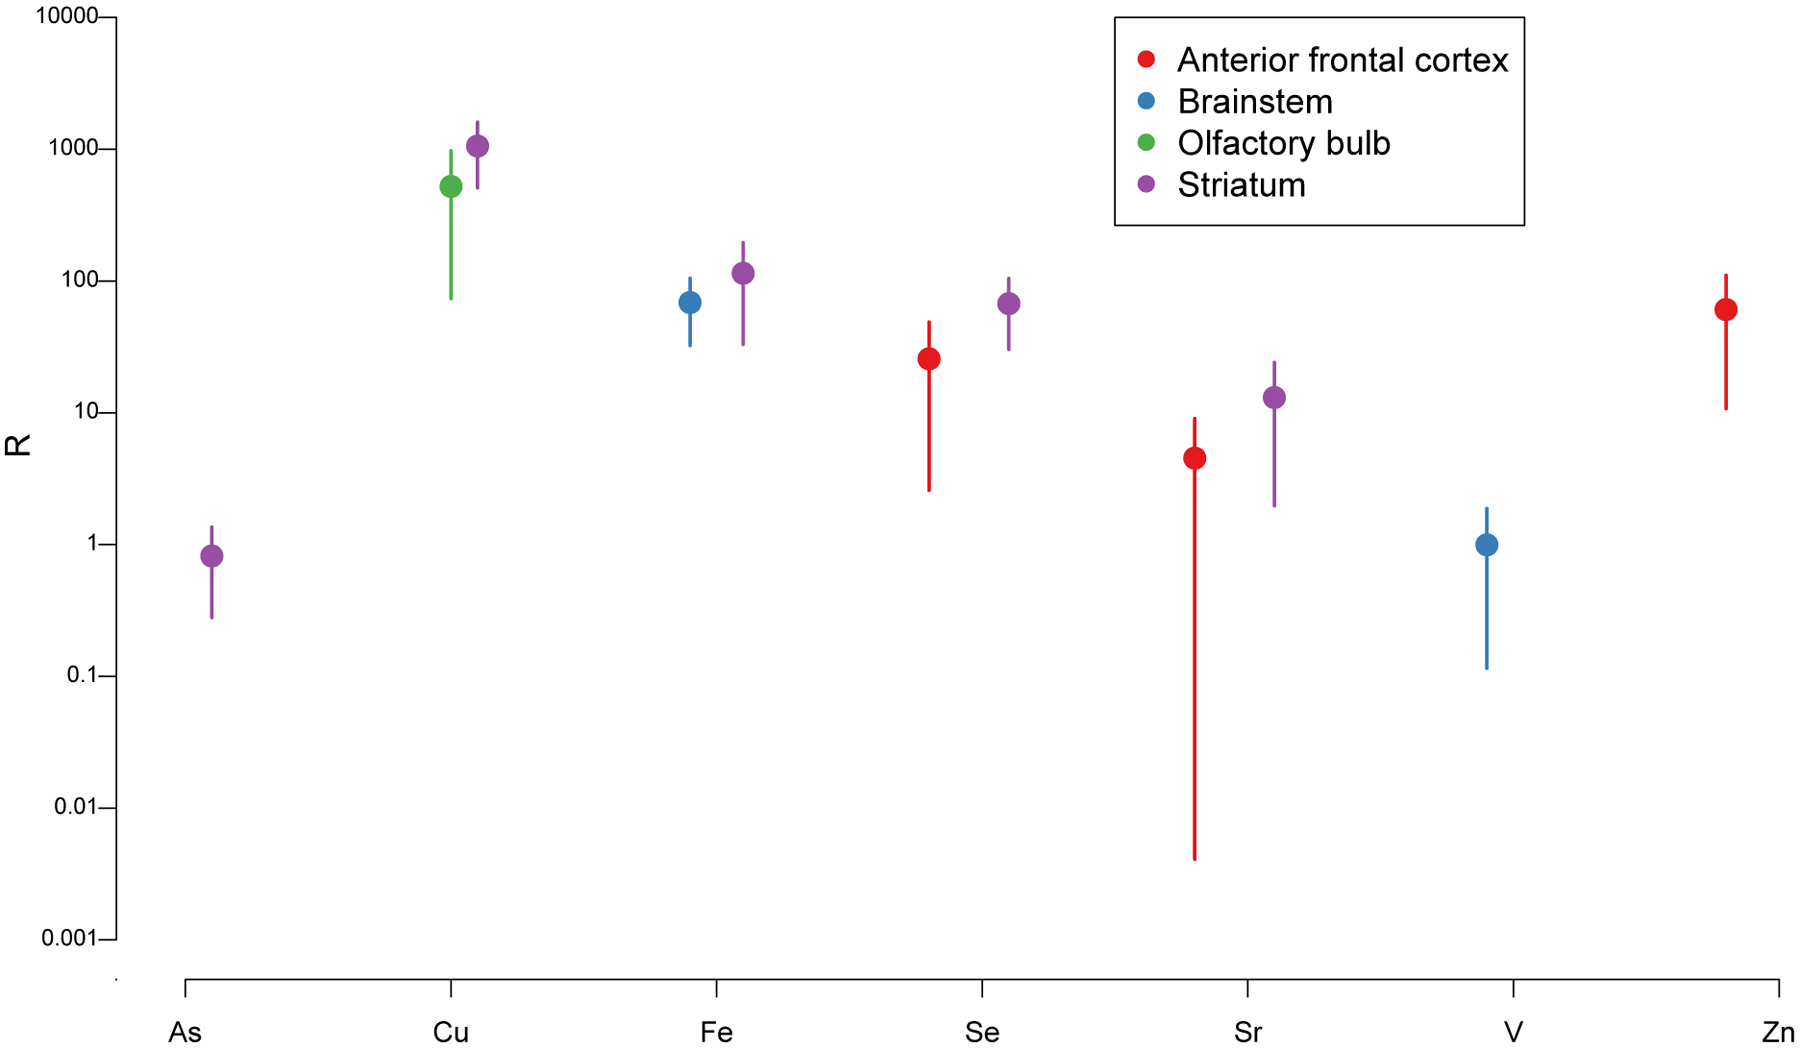
Figure 6: Partitioning ratio R.

This ratio defined in Equation (1) quantifies the ratio between the mean metal level in a given tissue type from mice exposed to the high e-cigarette dose (relative to mean metal level in the control group) and the aerosol metal level. High R values indicate bio-accumulation. Vertical bars indicate 95% confidence intervals. Values are shown only for metal-tissue combinations for which R is significantly positive.
