
Figure 1. Associations of the PFAS mixture with (a) total 25(OH)D concentrations, and with (b) free 25(OH)D concentrations based on weighted quantile sum regression (WQS) analyses in pregnant African American women in the Atlanta area, 2014–2018.
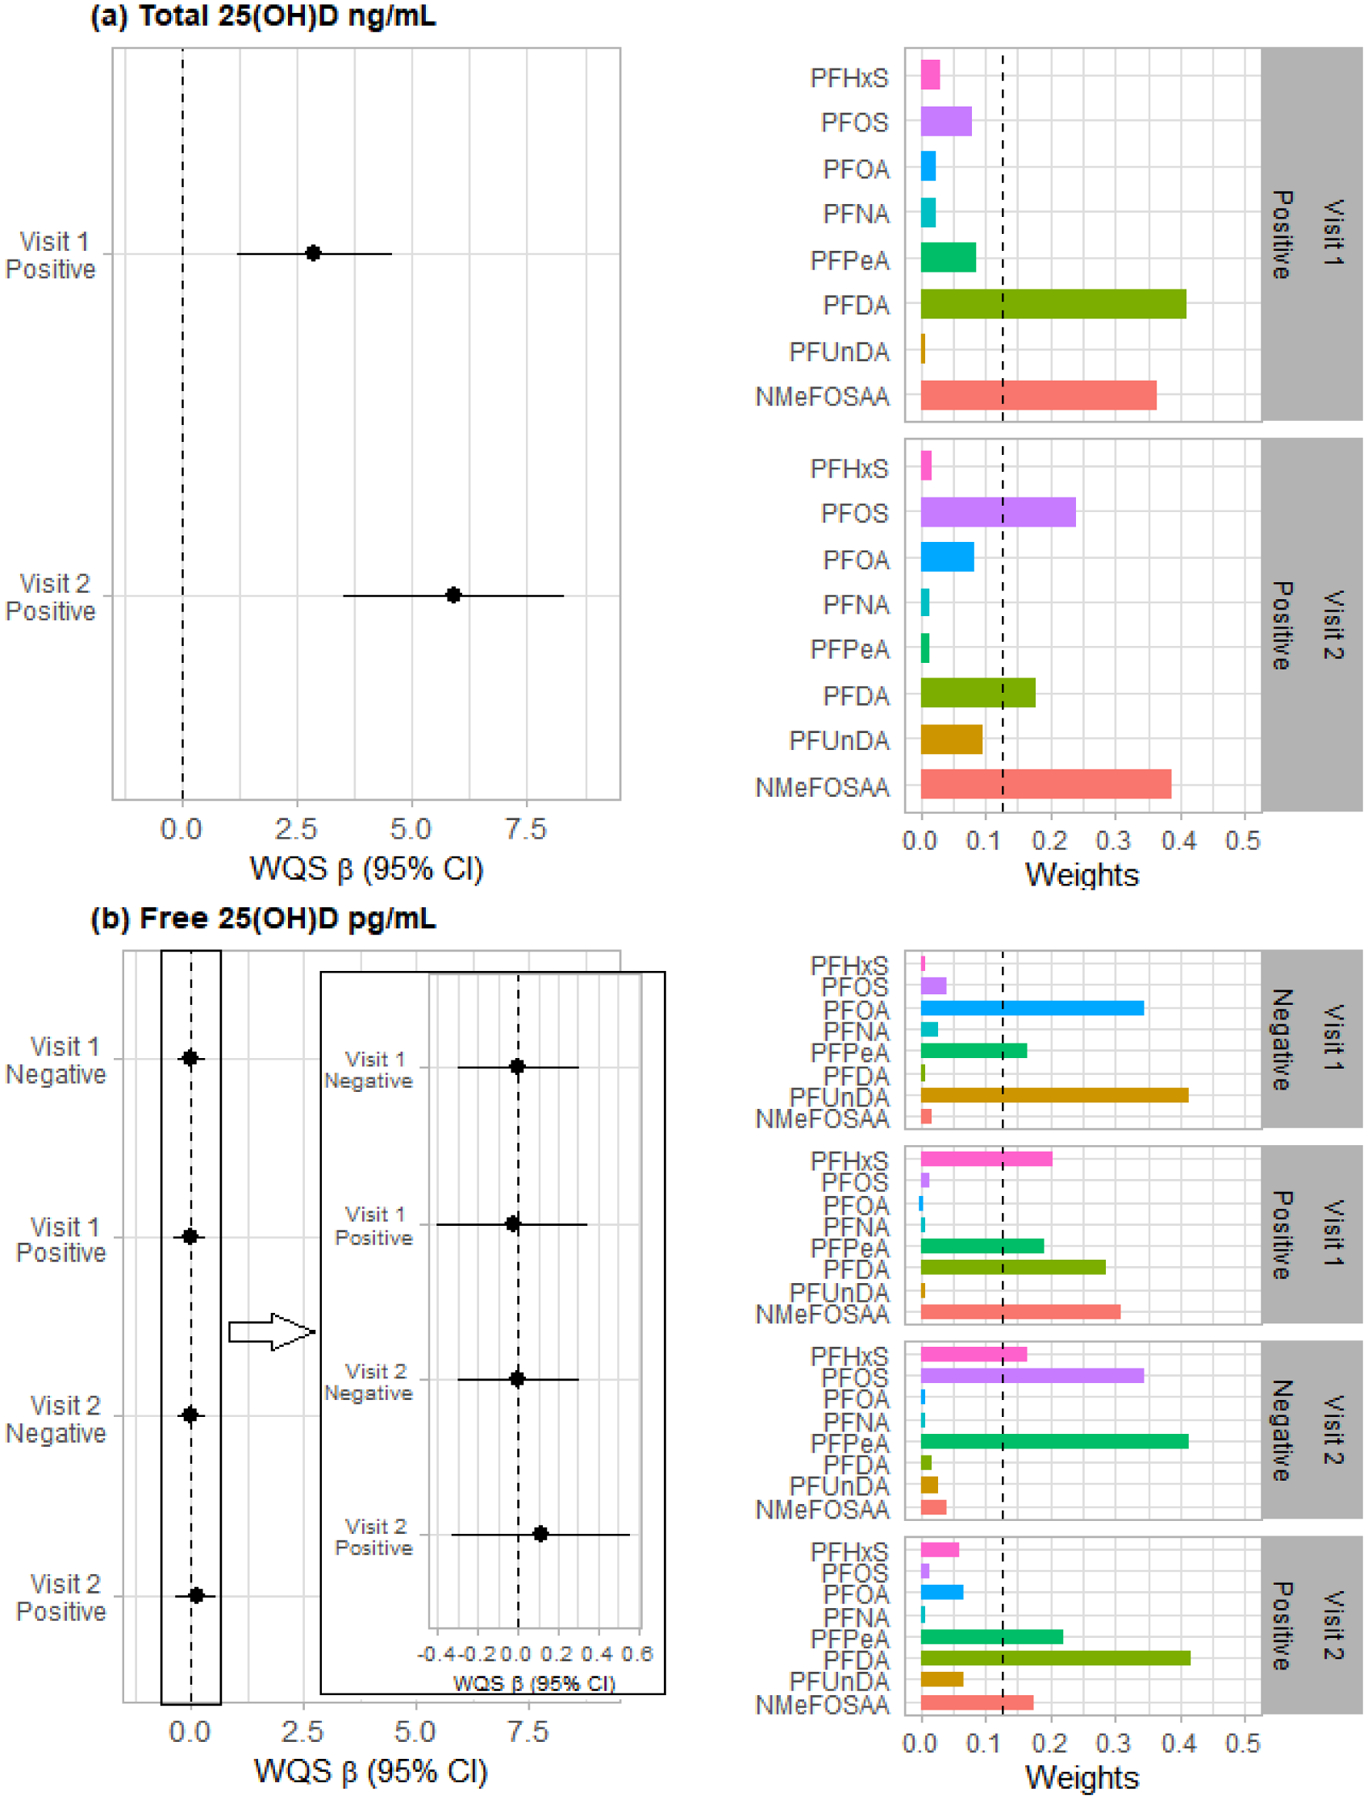
The models were adjusted for maternal age, education, BMI, parity, fetal sex, tobacco use, marijuana use, and season of sample collection for 25(OH)D. We ran each model twice, one in positive and one in negative direction of effects. Sample numbers are 346, 261, 348, and 264 for the models of total 25(OH)D at Visit 1, total 25(OH)D at Visit 2, free 25(OH)D at Visit 1, and free 25(OH)D at Visit 2, respectively. Note: Visit 1 = 25(OH)D collected at 8–14 weeks of gestation; Visit 2 = 25(OH)D collected at 24–30 weeks of gestation; the dashed line on the right bar chart represent the a priori cut-point for identification of important agents: 1/numer of chemicals = 1/8 = 0.125.