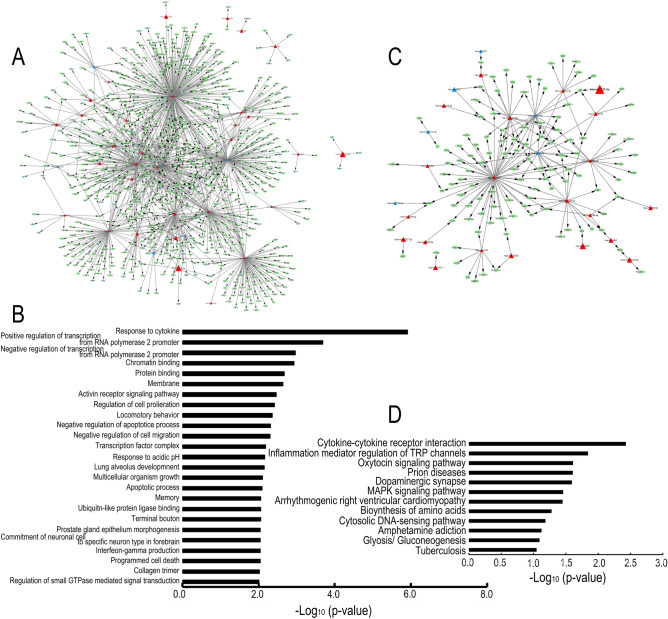
Figure 3.
Exosomal miRNA bioinformatic analysis under TGF-β2 stimulation. (A and C) Network of miRNA-mRNA pairs associated with GO terms (A) and with KEGG pathways (C). Triangular and circular nodes represent miRNAs and predicted target mRNAs, respectively. High and low expression are represented in red and blue, respectively. (B and D) Histograms of significantly upregulated signaling pathways were generated according to the results of Gene Ontology (GO) (B) and Kyoto Encyclopedia of Genes and Genomes (KEGG) pathway analyses (D). The X-axis represents the logarithm of the p-value, and the Y-axis represents the name of the signaling pathways.

