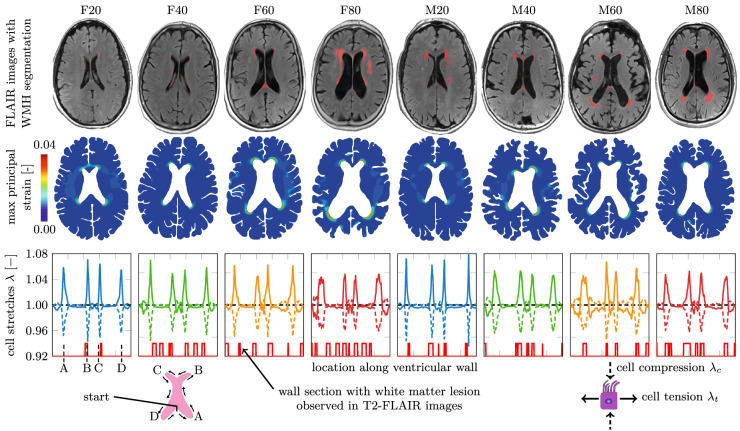
Figure 5.
Eight finite element models were created from FLAIR MRI with WMHs shown in red (top row). We simulated quasistatic ventricular expansion during peak loading to determine ventricular wall strain and ependymal cell stretch. The distribution of maximum principal strain (middle row) is consistent across all individuals, with peak strain localizing around the anterior and posterior horns of the lateral ventricles. Based on the deformation fields, we determine ependymal cell stretch along the ventricular wall. We calculate ependymal cell tension, which is tangential to the ependymal wall, and ependymal cell compression, which is perpendicular to the ependymal wall. We observe four distinct locations with maximum stretches along the wall. These coincide with the horns, as indicated by points A, B, C, and D. We report both stretch components for every point along the ependymal wall as shown in the ventricular representation in the legend.

