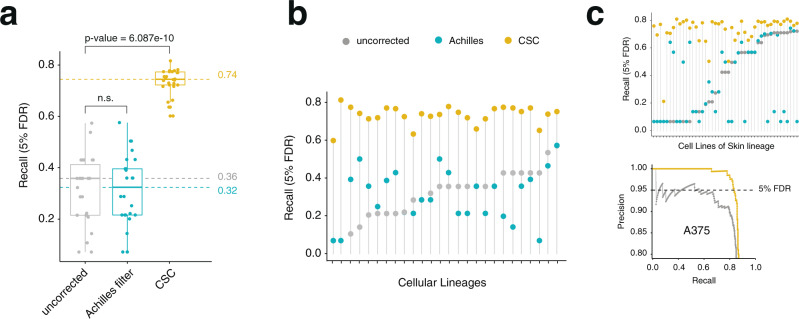
Fig. 3. CSC improves the performance of CRISPR-Cas9 essentiality screens.
a Boxplot showing recall values at 5% FDR for the 19Q4 Project Achilles dataset (n = 689) before correction (grey), with the Achilles filter (blue), or with the CSC correction (yellow). Each dot represents the median recall value of a lineage (n = 26). Minimum, maximum, median, first, and third quartiles are shown. p-values were calculated using a two-sided Wilcoxon test. b Median recall values at 5% FDR for each lineage. c Top, example plot for a single lineage (skin). Bottom, example precision-recall plot for a single cell line (A375 melanoma cells). Lollipop graphs are plotted by increasing values of the uncorrected pipeline. The maximum recall value at 5% FDR was used for each comparison.

