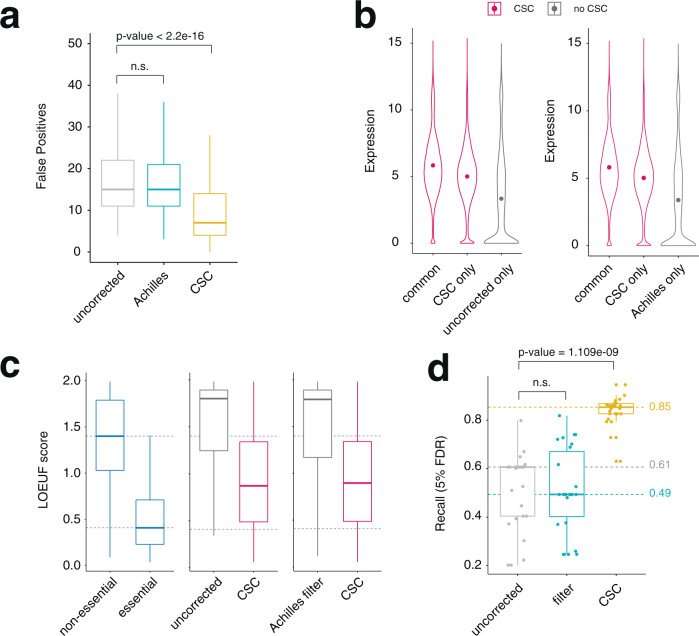
Fig. 4. CSC improves the identification of true gene dependencies.
a Boxplot showing number of false positive hits for the 19Q4 Project Achilles dataset (n = 689) before correction (grey), with the Achilles filter (blue), or with the CSC correction (yellow). For comparison purposes, Bayes Factor thresholds were varied to return the same number of hits across all three pipelines. p-values were calculated using a two-sided Wilcoxon test. b Violin plots showing the expression levels (log2(TPM+1)) of genes in the cell lines in which they were identified as dependencies. Left graph shows genes identified both before and after correction (common), only after correction (CSC only) or only before correction (uncorrected only). Right graph shows genes identified as dependencies both in pipelines that implement CSC and Achilles (common), or only in one of the pipelines (CSC only, Achilles only). Dot represents the mean value. c Boxplots showing the LOEUF scores for genes identified as dependencies by only one of the pipelines. Exclusive dependencies are defined as genes that score in more than 15 cell lines in one pipeline and none in the other (uncorrected versus CSC: n = 832; Achilles versus CSC plot n = 835). LOEUF scores for constitutive essential and non-essential genes are shown on the left as a reference (n = 1169), and their median values are highlighted across all plots with a dashed line. d Recall values as in Fig. 2a but calculated using known constitutive essential and non-essential genes targeted by at least one unspecific gRNA (H0 > 1). Filter corresponds to a pipeline where gRNAs with more than one perfect target site are removed before the analysis. Boxplots show minimum, maximum, median, first, and third quartiles.

