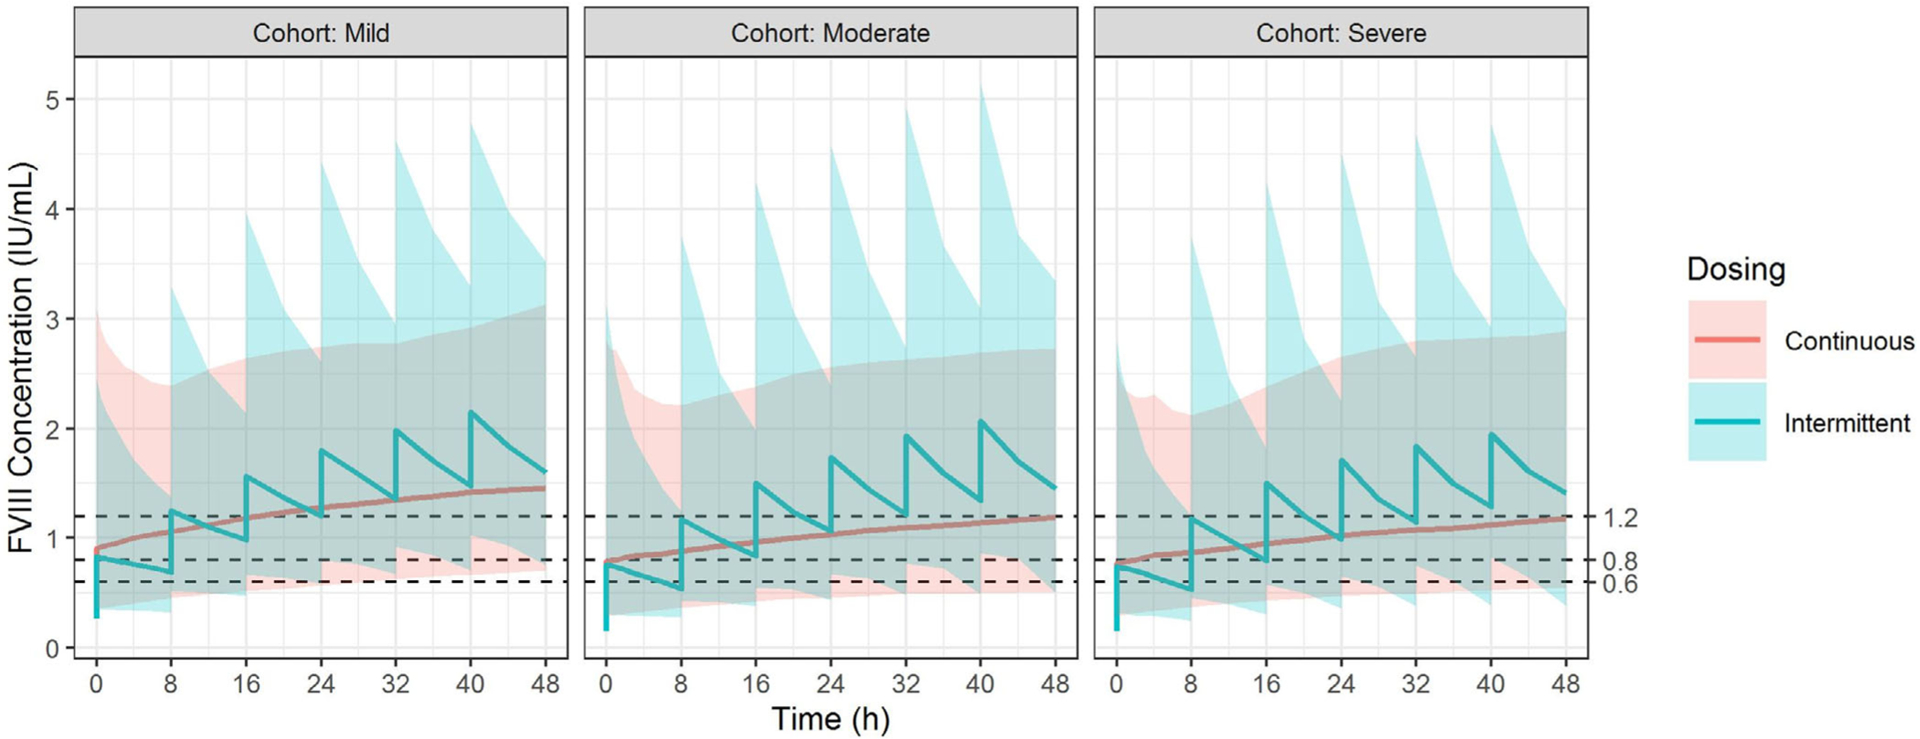
FIGURE 5.

Dosing simulation results for intermittent bolus and continuous infusion. The simulated FVIII concentrations are shown below based on the modified UNC population pharmacokinetic model. The X-axis denotes the time after the patient was admitted while the Y-axis denotes the FVIII concentrations (IU/ml). The three panels from left to right represent patients with mild (initial FVIII concentration > .05 IU/ml), moderate (initial FVIII concentration .01–.05 IU/ml), and severe haemophilia A (initial FVIII concentration < .01 IU/ml). The red line and shaded area represent the median, and the 95% prediction interval of the simulated results for CI while the blue line and shaded area represent those of the IB dose. CI, continuous infusion; FVIII, factor VIII; IB, intermittent bolus
