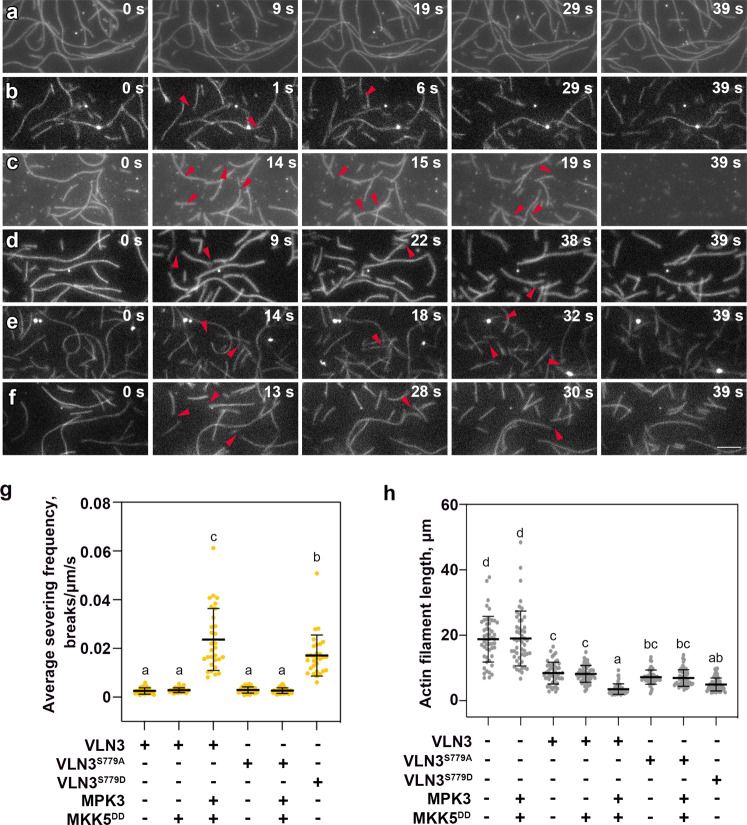
Fig. 4. The phosphorylated VLN3 shows enhanced Ca2+-dependent severing activity.
VLN3-mediated actin filament severing was visualized by time-lapse TIRF microscopy. Oregon-green labeled actin filaments adhered to the cover slip of a perfusion chamber, and then 1 nM wild-type or mutant VLN3 in the presence of 10 µM free Ca2+ was perfused into the chamber. Time-lapse images were collected every second. Individual filaments showed breaks (arrows) along their length. The elapsed time in seconds is provided in the top right corner of each image (a, actin + MPK3 + MKK5DD; b, actin + VLN3; c, actin + VLN3 + MPK3 + MKK5DD; d, actin + VLN3S779A + MPK3 + MKK5DD; e, actin + VLN3S779D; f, actin + VLN3 + MKK5DD). See also Supplementary Movies 1 to 6 online. Bars = 5 µm. g Severing frequency was calculated as the number of breaks per unit filament length per unit time. h Average actin filament length was measured for each indicated reaction. Value are means ± SD. n = 30 in (g), n = 50 in (h) filaments from at least 5 images for each treatment. Different letters indicate significant differences at P < 0.05, as determined by two-way ANOVA with Tukey’s multiple comparisons test. The exact p values are provided in the Source Data file.

