
Figure 1: Infiltrating Tregs increase in the tumor after PD-1 blockade.
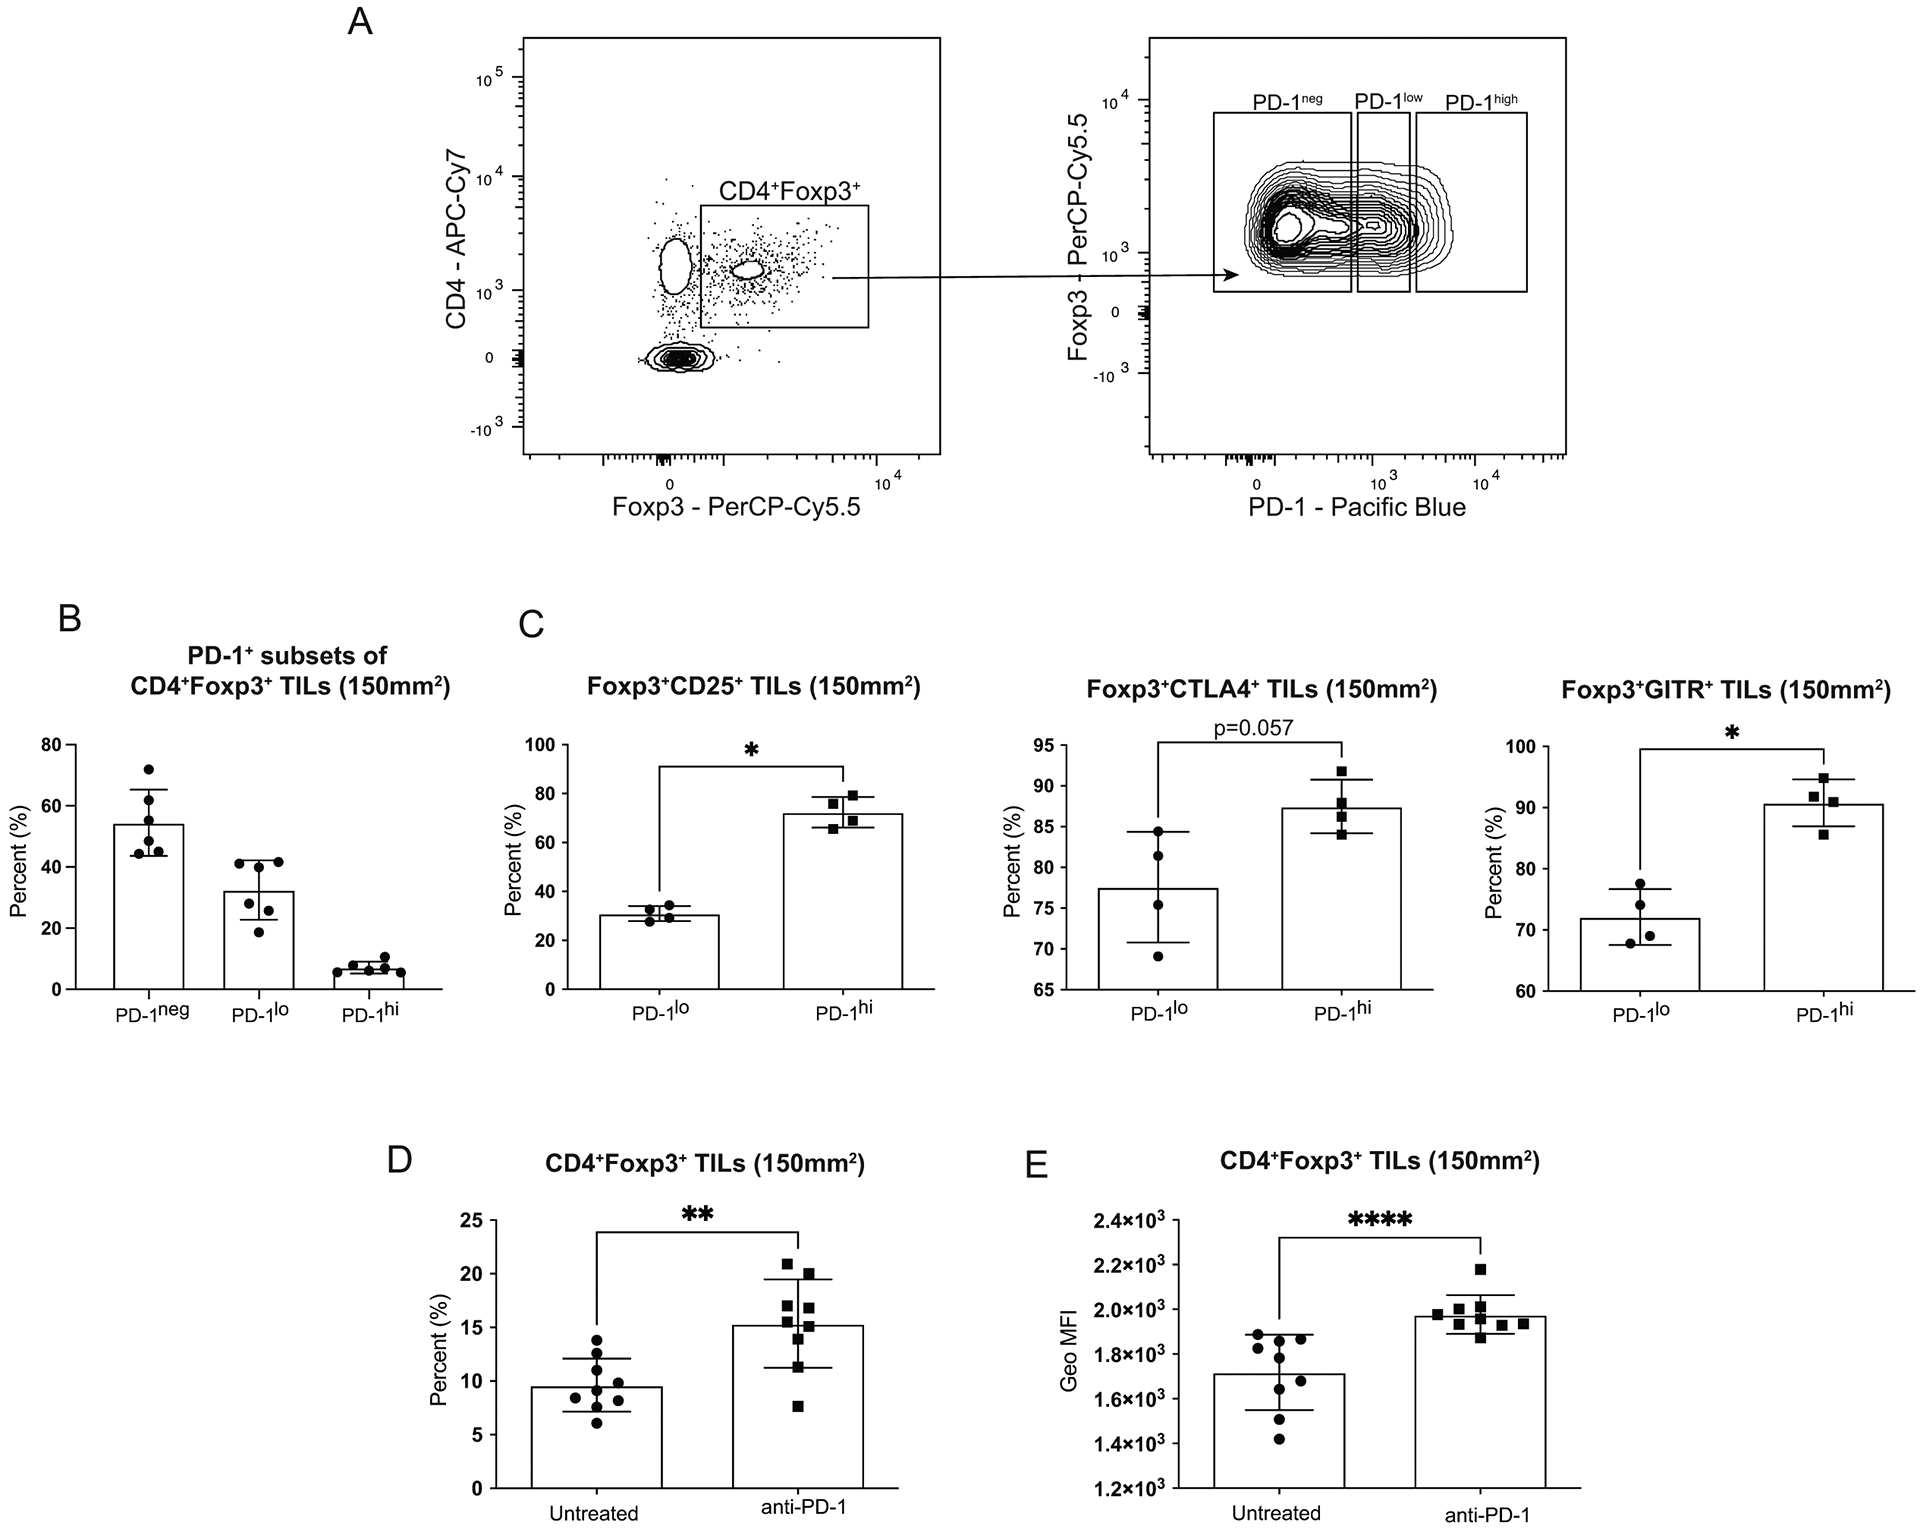
Mice were injected with 1 × 10⁴ T11 (claudin-low) tumor cells. Tumors were harvested at 150mm2, digested, enriched for lymphocytes, and analyzed by FACS. Cells were gated on Lymphocytes/ Single Cells/ Live/ CD3+/ CD4+Foxp3+ then analyzed for Treg markers. (A) Representative flow plots gated on CD4+Foxp3+ Tregs showing PD-1 expression levels. (B) Percent PD-1neg, PD-1lo, and PD-1hi CD4+Foxp3+ Tregs (n=6). (C) Percent CD4+Foxp3+ Tregs expressing CD25 or CTLA4 in PD-1lo versus PD-1hi populations (n=4). (D-E) Mice were untreated or treated with 200μg α-PD-1 antibody (J43) injected IP twice a week for the duration of the experiment. (D) Percent CD4+Foxp3+ Tregs from CD45+ gated population (n=9). (E) Geometric Mean Fluorescence Intensity of Foxp3 in CD4+Foxp3+ cells (n=9). Statistical significance determined by Mann-Whitney test. * denotes p < 0.05. ** denotes p < 0.01. **** denotes p < 0.0001.