
Figure 2: Treg transcriptional profile changes with PD-1 blockade compared to untreated.
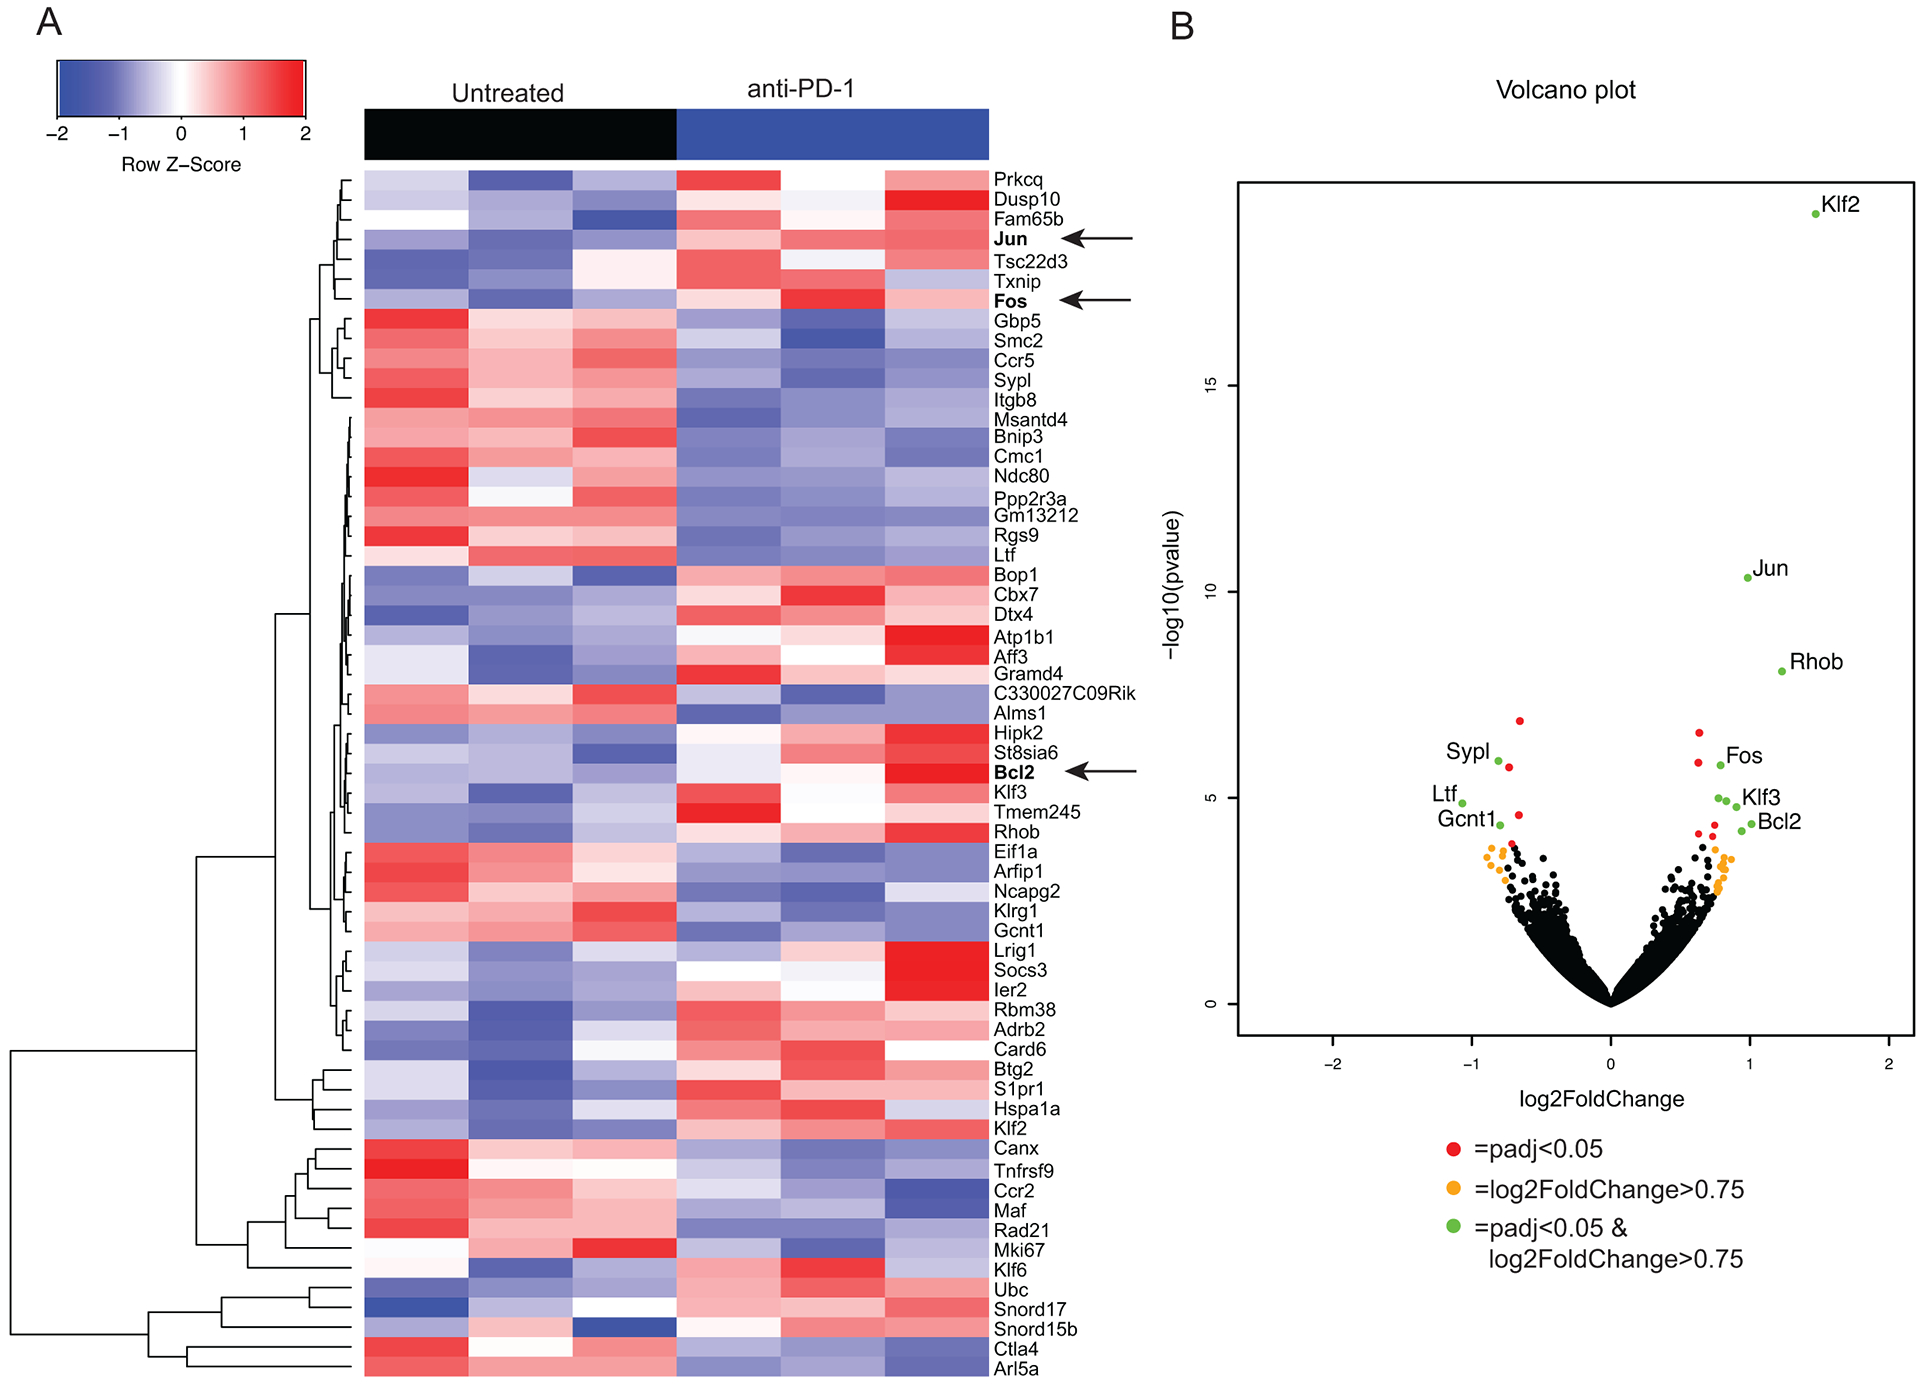
Foxp3-GFP mice were injected with 1 × 10⁴ T11 (claudin-low) cells and were untreated or treated with 200 μg α-PD1 antibody (J43) injected IP twice a week. Tumors were harvested at 150 mm2, digested, enriched for lymphocytes, and GFP+ Tregs were sorted to greater than 90% purity using MoFlo XDP cell sorter. RNA was isolated from sorted cells and RNA-Seq was performed on the HiSeq 2500 Rapid Run platform. (n=6) (A) Samples were clustered using hierarchal clustering. Z-score of raw counts normalized among samples within each group. (B) Volcano plot showing significantly differentially regulated genes with a p adjusted value <0.05 and a log2 Fold Change >0.75.