
Figure 6: PD-1 blockade results in increased suppressive capabilities in Tregs.
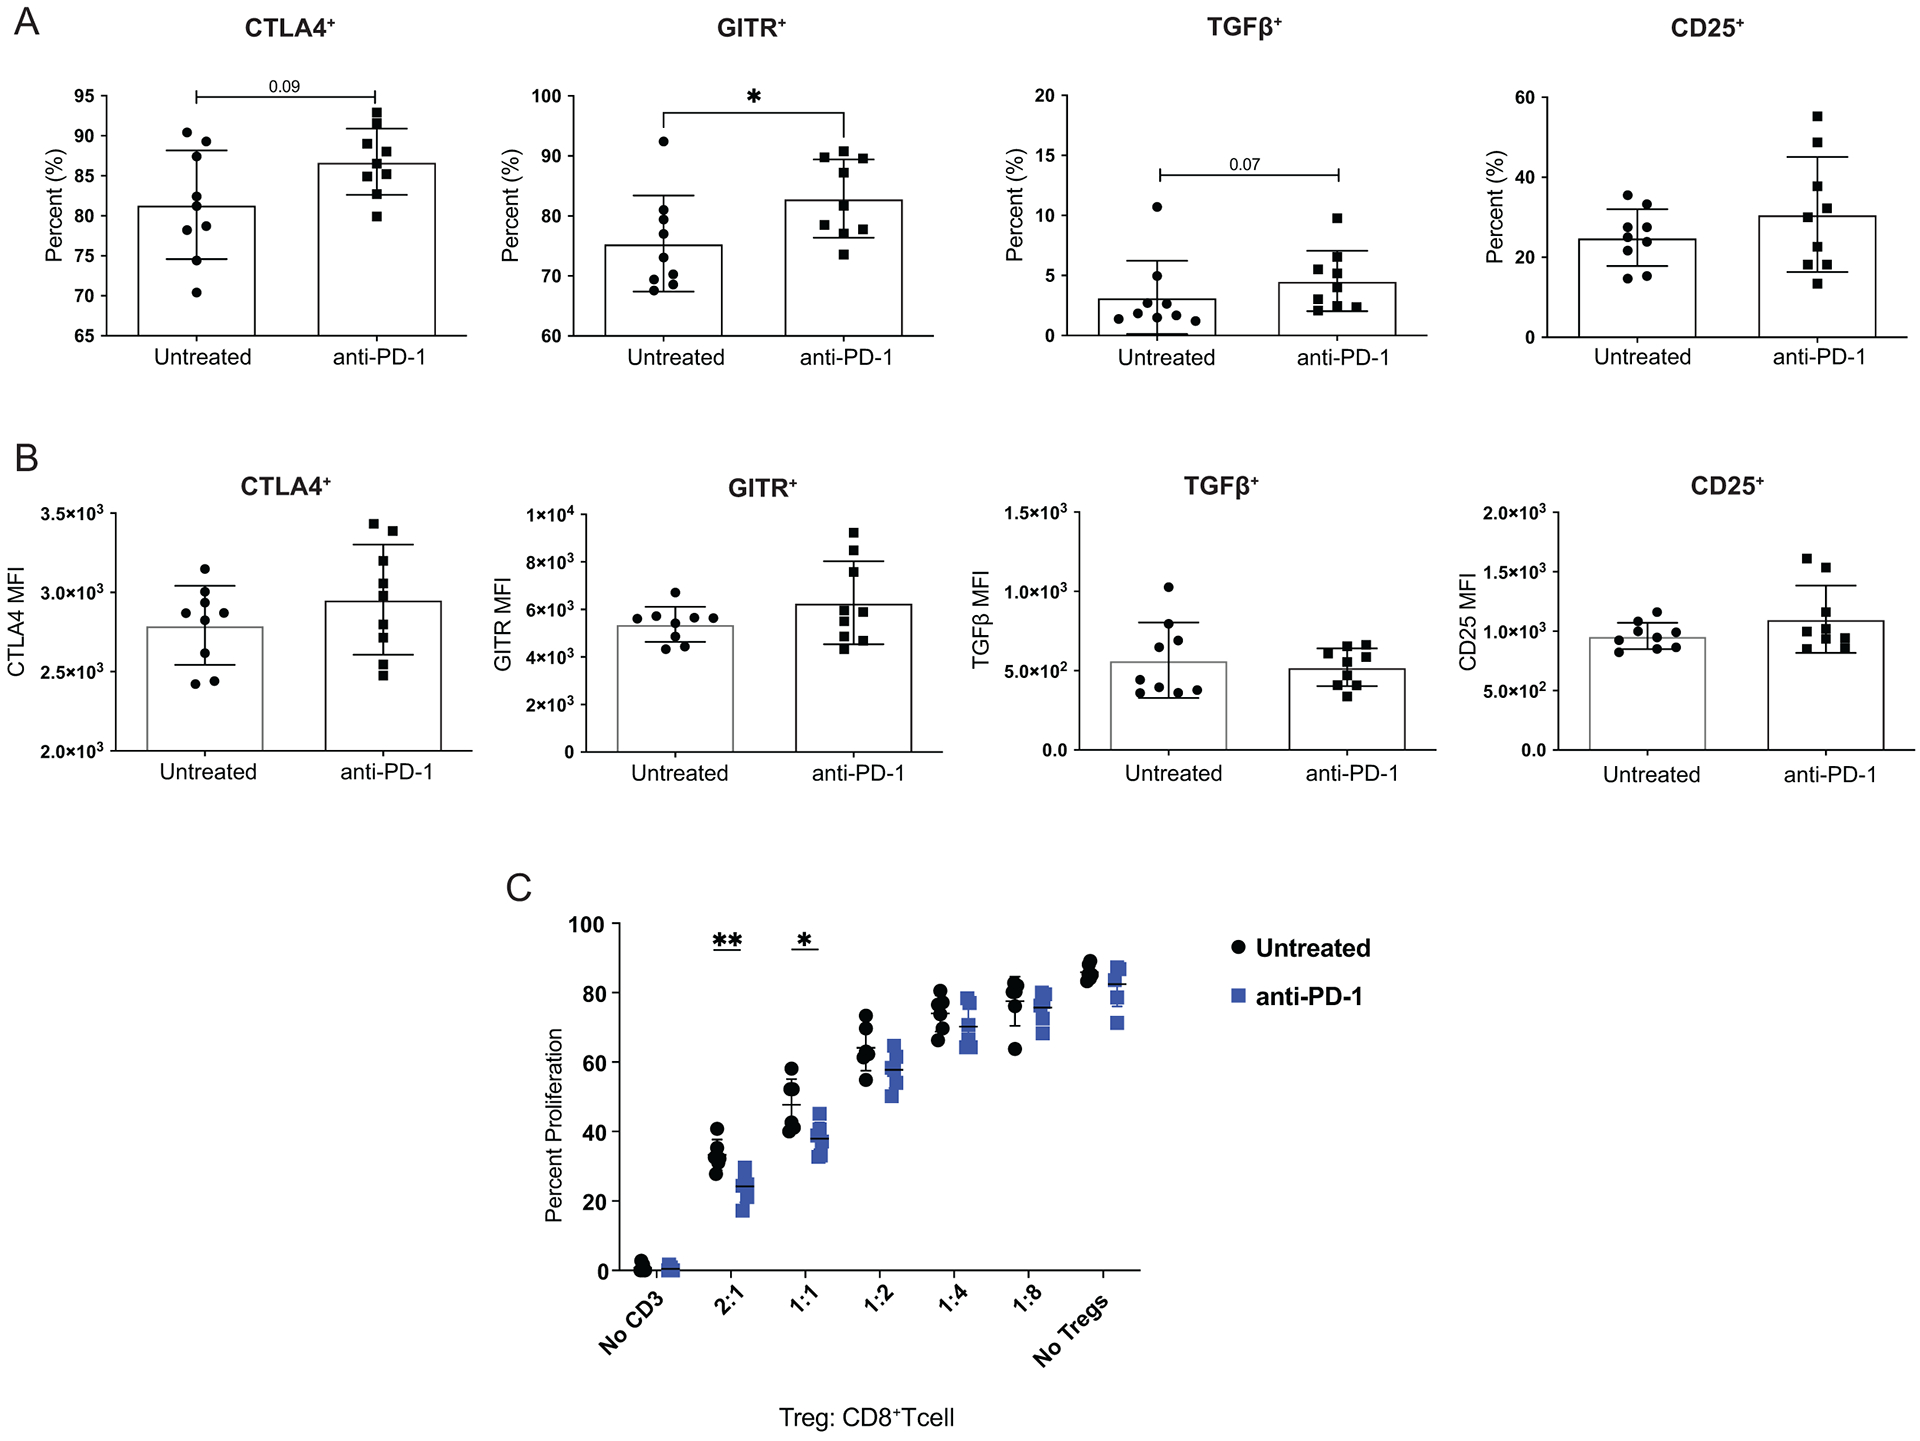
Mice were injected with 1 × 10⁴ T11 (claudin-low) tumor cells. Mice were untreated or treated with 200 μg α-PD-1 antibody (J43) injected IP twice a week for the duration of the experiment. (A-B) Tumors were harvested at 150mm2, digested, enriched for lymphocytes, and analyzed by FACS. Cells were gated on Lymphocytes/ Single Cells/ Live/ CD3+/ CD4+Foxp3+ then analyzed for Treg markers. (A) Percent CD4+Foxp3+ Tregs expressing suppressive molecules; CTLA4, GITR, TGF-β, and CD25 from mice treated with α-PD-1 versus untreated (n=9). (B) Geometric Mean Fluorescence Intensity of suppressive molecules in CD4+Foxp3+ cells (n=9). Statistical significance determined by Mann-Whitney test. (C) Tumors were harvested at 150mm2, digested, enriched for lymphocytes, and GFP+ Tregs were sorted using MoFlo-XDP cell sorter. Naive T cells were stained with proliferation dye and were incubated with sorted Tregs, irradiated APCs, and soluble α-CD3 in culture for 72 hours. Statistical significance determined by multiple t-tests. * denotes p < 0.05. ** denotes p < 0.01.